How To Install Logstash on Ubuntu 18.04 and Debian 9

How To Install Logstash on Ubuntu 18.04 and Debian 9 | Tutorial on Logstash Configuration

Are you searching various websites to learn How To Install Logstash on Ubuntu 18.04 and Debian 9? Then, this tutorial is the best option for you all as it covers the detailed steps to install and configure the Logstash on Ubuntu 18.4 and Debian 9. If you are browsing this tutorial, it is apparently because you preferred to bring Logstash into your infrastructure. Logstash is a powerful tool, but you have to install and configure it properly so make use of this tutorial efficiently.

What is Logstash?

Logstash is a lightweight, open-source, server-side data processing pipeline that lets you get data from different sources, transform it on the fly, and send it to your aspired destination. It is used as a data processing pipeline for Elasticsearch, an open-source analytics and search engine that points at analyzing log ingestion, parsing, filtering, and redirecting.

Why do we use Logstash?

We use Logstash because Logstash provides a set of plugins that can easily be bound to various targets in order to gather logs from them. Moreover, Logstash provides a very expressive template language, that makes it very easy for developers to manipulate, truncate or transform data streams.

Logstash is part of the ELK stack: Elasticsearch – Logstash – Kibana but tools can be used independently.

With the recent release of the ELK stack v7.x, installation guides need to be updated for recent distributions like Ubuntu 18.04 and Debian 9.

Do Check: 

Prerequisites

  • Java version 8 or 11 (required for Logstash installation)
  • A Linux system running Ubuntu 20.04 or 18.04
  • Access to a terminal window/command line (Search > Terminal)
  • A user account with sudo or root privileges

Steps to Install install Logstash on Ubuntu and Debian

The following are the steps to install Logstash on Ubuntu and Debian: 

1 – Install the latest version of Java

Logstash, as every single tool of the ELK stack, needs Java to run properly.

In order to check whether you have Java or not, run the following command:

$ java -version
openjdk version "11.0.3" 2019-04-16
OpenJDK Runtime Environment (build 11.0.3+7-Ubuntu-1ubuntu218.04.1)
OpenJDK 64-Bit Server VM (build 11.0.3+7-Ubuntu-1ubuntu218.04.1, mixed mode, sharing)

If you don’t have Java on your computer, you should have the following output.

java-not-found

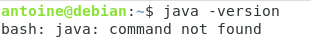
You can install it by running this command.

$ sudo apt-get install default-jre

Make sure that you now have Java installed via the first command that we run.

2 – Add the GPG key to install signed packages

In order to make sure that you are getting official versions of Logstash, you have to download the public signing key and you have to install it.

To do so, run the following commands.

$ wget -qO - https://artifacts.elastic.co/GPG-KEY-elasticsearch | sudo apt-key add -

On Debian, install the apt-transport-https package.

$ sudo apt-get install apt-transport-https

To conclude, add the Elastic package repository to your own repository list.

$ echo "deb https://artifacts.elastic.co/packages/7.x/apt stable main" | sudo tee -a /etc/apt/sources.list.d/elastic-7.x.list

3 – Install Logstash with apt

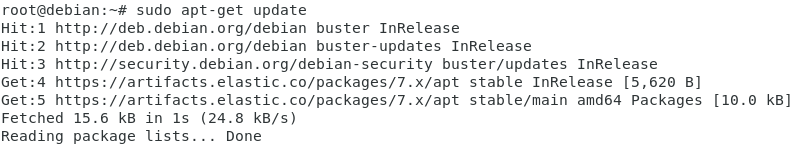
Now that Elastic repositories are added to your repository list, it is time to install the latest version of Logstash on our system.

$ sudo apt-get update
$ sudo apt-get install logstash

apt-get-update

This directive will :

  • create a logstash user
  • create a logstash group
  • create a dedicated service file for Logstash

From there, running Logstash installation should have created a service on your instance.

To check Logstash service health, run the following command.
On Ubuntu and Debian, equipped with system

$ sudo systemctl status logstash

Enable your new service on boot up and start it.

$ sudo systemctl enable logstash
$ sudo systemctl start logstash

Having your service running is just fine, but you can double-check it by verifying that Logstash is actually listening on its default port, which is 5044.

Run a simple netstat command, you should have the same output.

$ sudo lsof -i -P -n | grep logstash
java      28872        logstash   56u  IPv6 1160098302      0t0  TCP 
127.0.0.1:47796 > 127.0.0.1:9200 (ESTABLISHED)
java      28872        logstash   61u  IPv4 1160098304      0t0  UDP 127.0.0.1:10514
java      28872        logstash   79u  IPv6 1160098941      0t0  TCP 127.0.0.1:9600 (LISTEN)

As you can tell, Logstash is actively listening for connections on ports 10514 on UDP and 9600 on TCP. It is important to note if you were to forward your logs (from rsyslog to Logstash for example, either by UDP or by TCP).

On Debian and Ubuntu, here’s the content of the service file.

[Unit]
Description=logstash

[Service]
Type=simple
User=logstash
Group=logstash
# Load env vars from /etc/default/ and /etc/sysconfig/ if they exist.
# Prefixing the path with '-' makes it try to load, but if the file doesn't
# exist, it continues onward.
EnvironmentFile=-/etc/default/logstash
EnvironmentFile=-/etc/sysconfig/logstash
ExecStart=/usr/share/logstash/bin/logstash "--path.settings" "/etc/logstash"
Restart=always
WorkingDirectory=/
Nice=19
LimitNOFILE=16384

[Install]
WantedBy=multi-user.target

The environment file (located at /etc/default/logstash) contains many of the variables necessary for Logstash to run.

If you wanted to tweak your Logstash installation, for example, to change your configuration path, this is the file that you would change.

4 – Personalize Logstash with configuration files

In this step, you need to perform two more steps like as follows:

a – Understanding Logstash configuration files

Before personalizing your configuration files, there is a concept that you need to understand about configuration files.

Pipelines configuration files

In Logstash, you define what we called pipelines. A pipeline is composed of :

  • An input: where you take your data from, it can be Syslog, Apache, or NGINX for example;
  • A filter: a transformation that you would apply to your data; sometimes you may want to mutate your data, or to remove some fields from the final output.
  • An output: where you are going to send your data, most of the time Elasticsearch, but it can be modified to send a wide variety of different sources.

a – Understanding Logstash configuration files

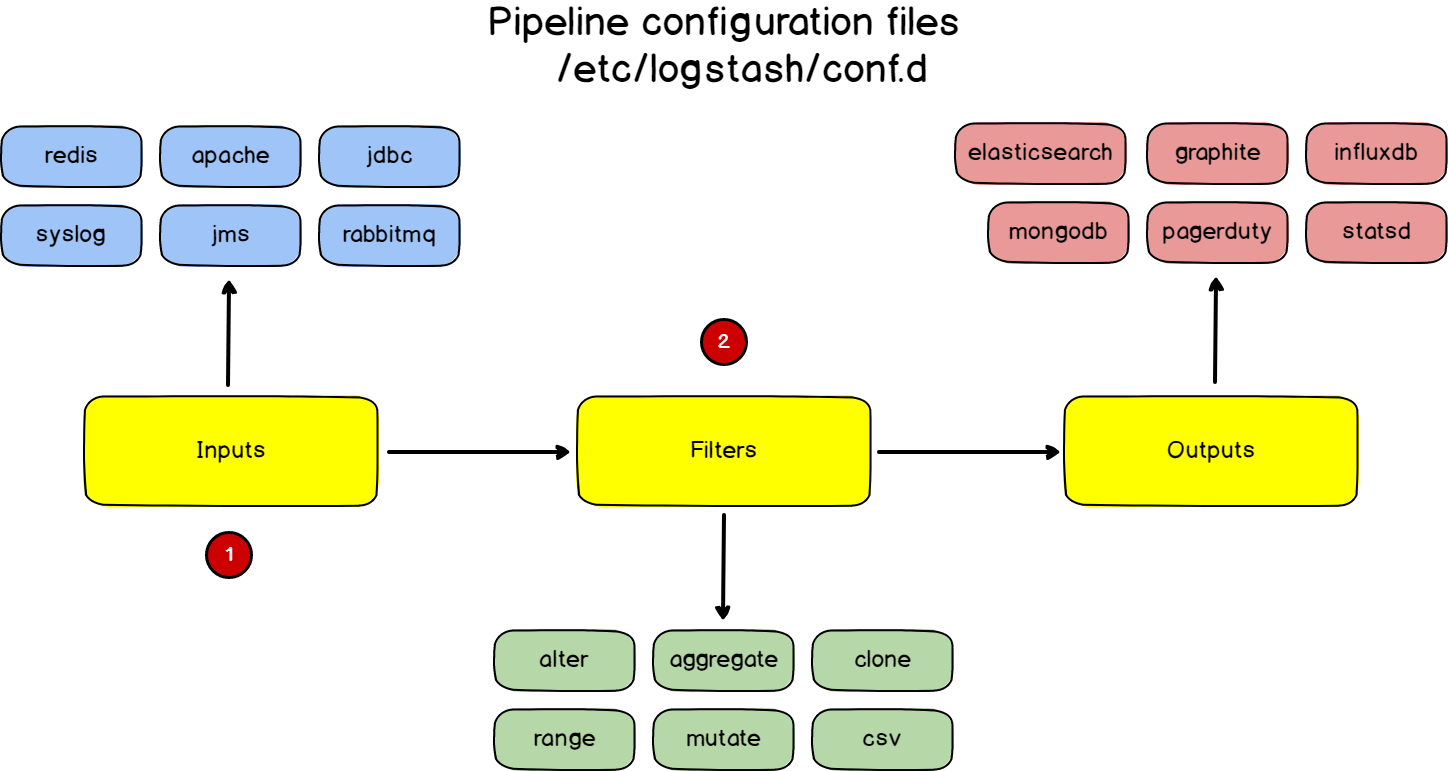
Those pipelines are defined in configuration files.

In order to define those “pipeline configuration files“, you are going to create “pipeline files” in the /etc/logstash/conf.d directory.

Logstash general configuration file

But with Logstash, you also have standard configuration files, that configure Logstash itself.

This file is located at /etc/logstash/logstash.yml. The general configuration files define many variables, but most importantly you want to define your log path variable and data path variable.

b – Writing your own pipeline configuration file

For this part, we are going to keep it very simple.

We are going to build a very basic logging pipeline between rsyslog and stdout.

Every single log process via rsyslog will be printed to the shell running Logstash.

As Elastic documentation highlighted it, it can be quite useful to test pipeline configuration files and see immediately what they are giving as an output.

If you are looking for a complete rsyslog to Logstash to Elasticsearch tutorial, here’s a link for it.

To do so, head over to the /etc/logstash/conf.d directory and create a new file named “syslog.conf

$ cd /etc/logstash/conf.d/
$ sudo vi syslog.conf

Paste the following content inside.

input {
  udp {
    host => "127.0.0.1"
    port => 10514
    codec => "json"
    type => "rsyslog"
  }
}

filter { }


output {
  stdout { }
}

As you probably guessed, Logstash is going to listen to incoming Syslog messages on port 10514 and it is going to print it directly in the terminal.

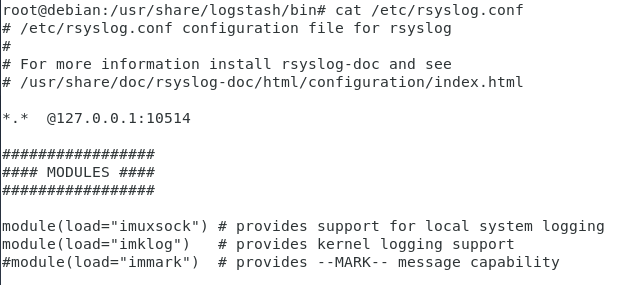
To forward rsyslog messages to port 10514, head over to your /etc/rsyslog.conf file, and add this line at the top of the file.

*.*         @127.0.0.1:10514

rsyslog-forwarding

Now in order to debug your configuration, you have to locate the logstash binary on your instance.

To do so, run a simple whereis command.

$ whereis -b logstash
/usr/share/logstash

Now that you have located your logstash binary, shut down your service and run logstash locally, with the configuration file that you are trying to verify.

$ sudo systemctl stop logstash
$ cd /usr/share/logstash/bin
$ ./logstash -f /etc/logstash/conf.d/syslog.conf

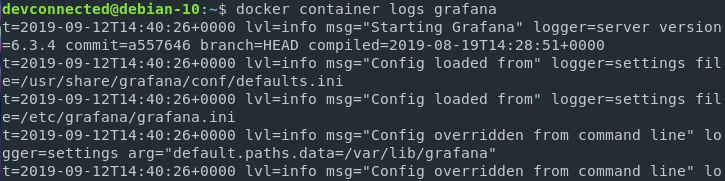
Within a couple of seconds, you should now see the following output on your terminal.

success-config-logstash

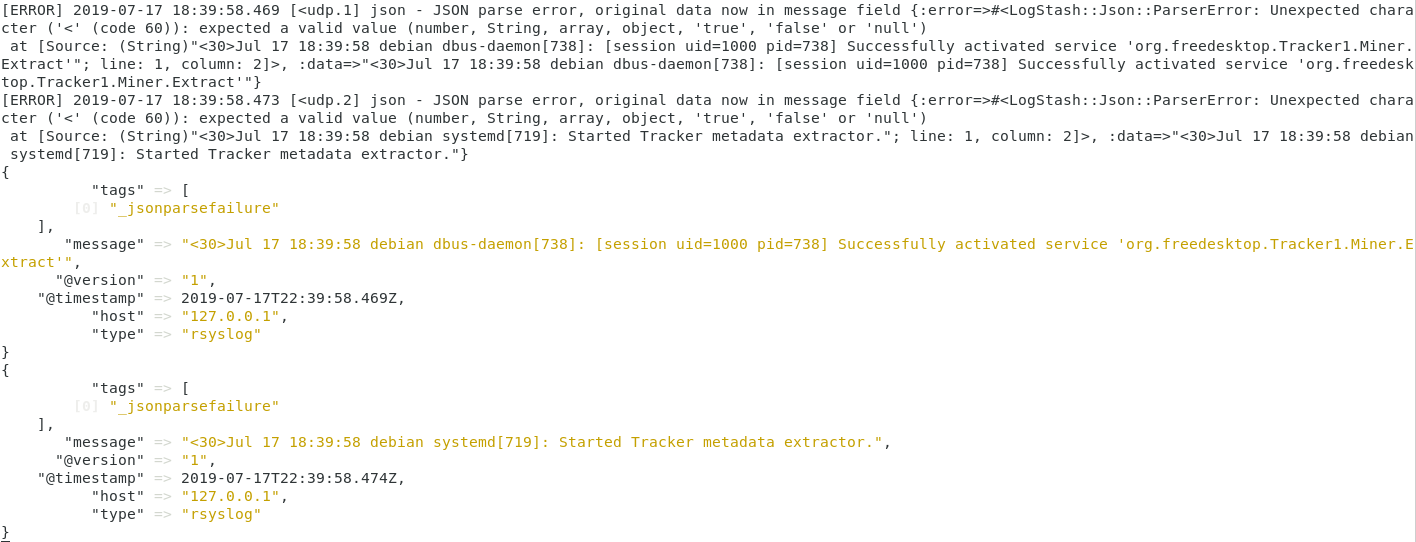
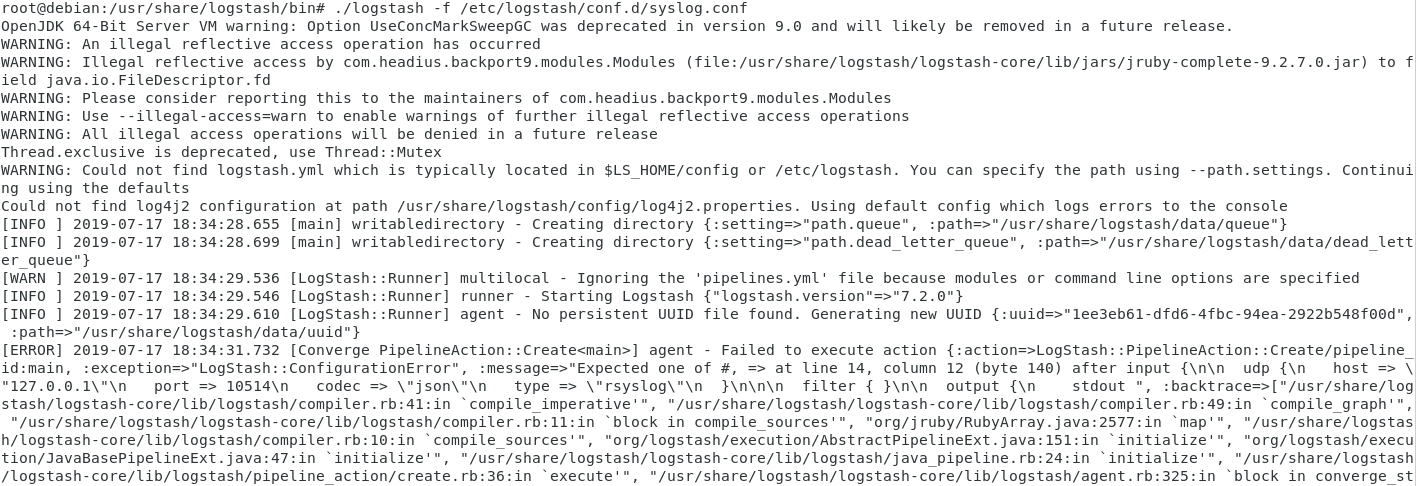
Note : if you have any syntax errors in your pipeline configuration files, you would also be notified.

As a quick example, I removed one bracket from my configuration file. Here’s the output that I got.

error-config-logstash

5 – Monitoring Logstash using the Monitoring API

There are multiple ways to monitor a Logstash instance:

  • Using the Monitoring API provided by Logstash itself
  • By configuring the X-Pack tool and sending retrieved data to an Elasticsearch cluster
  • By visualizing data into dedicated panels of Kibana (such as the pipeline viewer for example)

In this chapter, we are going to focus on the Monitoring API, as the other methods require the entire ELK stack installed on your computer to work properly.

a – Gathering general information about Logstash

First, we are going to run a very basic command to get general information about our Logstash instance.

Run the following command on your instance:

$ curl -XGET 'localhost:9600/?pretty'
{
  "host" : "devconnected-ubuntu",
  "version" : "7.2.0",
  "http_address" : "127.0.0.1:9600",
  "id" : "05cfb06f-a652-402c-8da1-f7275fb06312",
  "name" : "devconnected-ubuntu",
  "ephemeral_id" : "871ccf4a-5233-4265-807b-8a305d349745",
  "status" : "green",
  "snapshot" : false,
  "build_date" : "2019-06-20T17:29:17+00:00",
  "build_sha" : "a2b1dbb747289ac122b146f971193cfc9f7a2f97",
  "build_snapshot" : false
}

If you are not running Logstash on the conventional 9600 port, make sure to adjust the previous command.

From the command, you get the hostname, the current version running, as well as the current HTTP address currently used by Logstash.

You also get a status property (green, yellow, or red) that has already been explained in the tutorial about setting up an Elasticsearch cluster.

b – Retrieving Node Information

If you are managing an Elasticsearch cluster, there is a high chance that you may want to get detailed information about every single node in your cluster.

For this API, you have three choices:

  • pipelines: in order to get detailed information about pipeline statistics.
  • jvm: to see current JVM statistics for this specific node
  • os: to get information about the OS running your current node.

To retrieve node information on your cluster, issue the following command:

$ curl -XGET 'localhost:9600/_node/pipelines'
{
  "host": "schkn-ubuntu",
  "version": "7.2.0",
  "http_address": "127.0.0.1:9600",
  "id": "05cfb06f-a652-402c-8da1-f7275fb06312",
  "name": "schkn-ubuntu",
  "ephemeral_id": "871ccf4a-5233-4265-807b-8a305d349745",
  "status": "green",
  "snapshot": false,
  "pipelines": {
    "main": {
      "ephemeral_id": "808952db-5d23-4f63-82f8-9a24502e6103",
      "hash": "2f55ef476c3d425f4bd887011f38bbb241991f166c153b283d94483a06f7c550",
      "workers": 2,
      "batch_size": 125,
      "batch_delay": 50,
      "config_reload_automatic": false,
      "config_reload_interval": 3000000000,
      "dead_letter_queue_enabled": false,
      "cluster_uuids": []
    }
  }
}

Here is an example for the OS request:

$ curl -XGET 'localhost:9600/_node/os'
{
  "host": "schkn-ubuntu",
  "version": "7.2.0",
  "http_address": "127.0.0.1:9600",
  "id": "05cfb06f-a652-402c-8da1-f7275fb06312",
  "name": "schkn-ubuntu",
  "ephemeral_id": "871ccf4a-5233-4265-807b-8a305d349745",
  "status": "green",
  "snapshot": false,
  "os": {
    "name": "Linux",
    "arch": "amd64",
    "version": "4.15.0-42-generic",
    "available_processors": 2
  }
}

c – Retrieving Logstash Hot Threads

Hot Threads are threads that are using a large amount of CPU power or that have an execution time that is greater than normal and standard execution times.

To retrieve hot threads, run the following command:

$ curl -XGET 'localhost:9600/_node/hot_threads?pretty'
{
  "host" : "schkn-ubuntu",
  "version" : "7.2.0",
  "http_address" : "127.0.0.1:9600",
  "id" : "05cfb06f-a652-402c-8da1-f7275fb06312",
  "name" : "schkn-ubuntu",
  "ephemeral_id" : "871ccf4a-5233-4265-807b-8a305d349745",
  "status" : "green",
  "snapshot" : false,
  "hot_threads" : {
    "time" : "2019-07-22T18:52:45+00:00",
    "busiest_threads" : 10,
    "threads" : [ {
      "name" : "[main]>worker1",
      "thread_id" : 22,
      "percent_of_cpu_time" : 0.13,
      "state" : "timed_waiting",
      "traces" : [ "java.base@11.0.3/jdk.internal.misc.Unsafe.park(Native Method)"...]
    } ]
  }
}

Installing Logstash on macOS with Homebrew

Elastic issues Homebrew formulae thus you can install Logstash with the Homebrew package manager.

In order to install with Homebrew, firstly, you should tap the Elastic Homebrew repository:

brew tap elastic/tap

Once you have clicked on the Elastic Homebrew repo, you can utilize brew install to install the default distribution of Logstash:

brew install elastic/tap/logstash-full

The above syntax installs the latest released default distribution of Logstash. If you want to install the OSS distribution, define this elastic/tap/logstash-oss.

Starting Logstash with Homebrew

To have launched start elastic/tap/logstash-full now and restart at login, run:

brew services start elastic/tap/logstash-full

To run Logstash, in the forefront, run:

logstash

Going Further

Now that you have all the basics about Logstash, it is time for you to build your own pipeline configuration files and start stashing logs.

I highly suggest that you verify Filebeat, which gives a lightweight shipper for logs and that simply be customized in order to build a centralized logging system for your infrastructure.

One of the key features of Filebeat is that it provides a back-pressure sensitive protocol, which essentially means that you are able to regulate the number that you receive.

This is a key point, as you take the risk of overloading your centralized server by pushing too much data to it.

For those who are interested in Filebeat, here’s a video about it.

Definitive Guide To InfluxDB

The Definitive Guide To InfluxDB In 2021 | InfluxDB Open Source Time Series Database

In this informative tutorial, we have covered complete details about InfluxDB like what exactly it is, why you use it, What value can developers design by fusing InfluxDB into their own environment? and many others.

Also, this guide can become an initial stage for every developer, engineer, and IT professional to understand InfluxDB concepts, use-cases, and real-world applications.

The main objective of curating this article is to make you an expert with InfluxDB in no time. So, we have designed the InfluxDB learning paths into diverse modules, each one of them bringing a new level of knowledge of time-series databases.

In this Definitive Guide To InfluxDB In 2021, firstly, you will gain some knowledge on the overall presentation of time-series databases, then with an in-depth explanation of the concepts that define InfluxDB, and at last, we explained the use-cases of InfluxDB and how it can be used in a variety of industries by using real-world examples.

Hence, step into the main topic and learn completely about InfluxDB Open Source Time Series Database, Key concepts, Use cases, etc. Let’s make use of the available links and directly jump into the required stuff of InfluxDB.

What is InfluxDB?

INfluxDB is definitely a fast-growing technology. The time-series database, developed by InfluxData, is seeing its popularity grow more and more over the past few months. It has become one of the references for developers and engineers willing to bring live monitoring into their own infrastructure.

Do Check: InfluxDays London Recap

What are Time-Series Databases?

Time Series Databases are database systems specially created to handle time-related data.

All your life, you have dealt with relational databases like MySQL or SQL Server. You may also have dealt with NoSQL databases like MongoDB or DynamoDB.

Those systems are based on the fact that you have tables. Those tables contain columns and rows, each one of them defining an entry in your table. Often, those tables are specifically designed for a purpose: one may be designed to store users, another one for photos, and finally for videos. Such systems are efficient, scalable, and used by plenty of giant companies having millions of requests on their servers.

Time series databases work differently. Data are still stored in ‘collections’ but those collections share a common denominator: they are aggregated over time.

Essentially, it means that for every point that you are able to store, you have a timestamp associated with it.

The great difference between relational databases and time series databases

The great difference between relational databases and time-series databases

But.. couldn’t we use a relational database and simply have a column named ‘time’? Oracle for example includes a TIMESTAMP data type that we could use for that purpose.

You could, but that would be inefficient.

Why do we need time-series databases?

Three words: fast ingestion rate.

Time series databases systems are built around the predicate that they need to ingest data in a fast and efficient way.

Indeed, relational databases do have a fast ingestion rate for most of them, from 20k to 100k rows per second. However, the ingestion is not constant over time. Relational databases have one key aspect that makes them slow when data tend to grow: indexes.

When you add new entries to your relational database, and if your table contains indexes, your database management system will repeatedly re-index your data for it to be accessed in a fast and efficient way. As a consequence, the performance of your DBMS tends to decrease over time. The load is also increasing over time, resulting in having difficulties to read your data.

Time Series databases are optimized for a fast ingestion rate. It means that such index systems are optimized to index data that are aggregated over time: as a consequence, the ingestion rate does not decrease over time and stays quite stable, around 50k to 100k lines per second on a single node.

difference-dbms-tsdb

Specific concepts about time-series databases

On top of the fast ingestion rate, time-series databases introduce concepts that are very specific to those technologies.

One of them is data retention. In a traditional relational database, data are stored permanently until your decide to drop them yourself. Given the use-cases of time series databases, you may want not to keep your data for too long: either because it is too expensive to do so, or because you are not that interested in old data.

Systems like InfluxDB can take care of dropping data after a certain time, with a concept called retention policy (explained in detail in part two). You can also decide to run continuous queries on live data in order to perform certain operations.

You could find equivalent operations in a relational database, for example, ‘jobs’ in SQL that can run on a given schedule.

A Whole Different Ecosystem

Time Series databases are very different when it comes to the ecosystem that orbits around them. In general, relational databases are surrounded by applications: web applications, software that connects to them to retrieve information or add new entries.

Often, a database is associated with one system. Clients connect to a website, that contacts a database in order to retrieve information. TSDB is built for client plurality: you do not have a simple server accessing the database, but a bunch of different sensors (for example) inserting their data at the same time.

As a consequence, tools were designed in order to have efficient ways to produce data or to consume it.

Data consumption

Data consumption is often done via monitoring tools such as Grafana or Chronograf. Those solutions have built-in solutions to visualize data and even make custom alerts with it.

consumption

Those tools are often used to create live dashboards that may be graphs, bar charts, gauges or live world maps.

Data Production

Data production is done by agents that are responsible for targeting special elements in your infrastructure and extract metrics from them. Such agents are called “monitoring agents“. You can easily configure them to query your tools in a given time span. Examples are Telegraf (which is an official monitoring agent), CollectD or StatsD

production

Now that you have a better understanding of what time series databases are and how they differ from relational databases, it is time to dive into the specific concepts of InfluxDB.

Illustrated InfluxDB Concepts

In this section, we are going to explain the key concepts behind InfluxDB and the key query associated with it. InfluxDB embeds its own query language and I think that this point deserves a small explanation.

InfluxDB Query Language

Before starting, it is important for you to know which version of InfluxDB you are currently using. As of April 2019, InfluxDB comes in two versions: v1.7+ and v2.0.

v2.0 is currently in alpha version and puts the Flux language as a centric element of the platform. v1.7 is equipped with InfluxQL language (and Flux if you activate it).

features (1)

The main differences between v1.7 and v2.0

Right now, I do recommend keeping on using InfluxQL as Flux is not completely established in the platform.

InfluxQL is a query language that is very similar to SQL and that allows any user to query its data and filter it. Here’s an example of an InfluxQL query :

influxql-example-1
See how similar it is to the SQL language?

In the following sections, we are going to explore InfluxDB key concepts, provided with the associated IQL (short for InfluxQL) queries.

Explained InfluxDB Key Concepts

influxdb-terms

In this section, we will go through the list of essential terms to know to deal with InfluxDB in 2021.

Database

database is a fairly simple concept to understand on its own because you are applied to use this term with relational databases. In a SQL environment, a database would host a collection of tables, and even schemas and would represent one instance on its own.

In InfluxDB, a database host a collection of measurements. However, a single InfluxDB instance can host multiple databases. This is where it differs from traditional database systems. This logic is detailed in the graph below :

influx-internals

The most common ways to interact with databases are either creating a database or by navigating into a database in order to see collections (you have to be “in a database” in order to query collections, otherwise it won’t work).

database-queries

Measurement

As shown in the graph above, the database stores multiple measurements. You could think of a measurement as a SQL table. It stores data, and even metadata, over time. Data that are meant to coexist together should be stored in the same measurement.

Measurement example

Measurement Example

Measurement IFQL example

Measurement IFQL example

In a SQL world, data are stored in columns, but in InfluxDB we have two other terms: tags & fields.

Tags & Fields

Warning! This is a very important chapter as it explains the subtle difference between tags & fields.

When I first started with InfluxDB, I had a hard time grasping exactly why are tags & fields different. For me, they represented ‘columns’ where you could store exactly the same data.

When defining a new ‘column’ in InfluxDB, you have the choice to either declare it as a tag or as a value and it makes a very big difference.

In fact, the biggest difference between the two is that tags are indexed and values are not. Tags can be seen as metadata defining our data in the measurement. They are hints giving additional information about data, but not data itself.

Fields, on the other side, is literally data. In our last example, the temperature ‘column’ would be a field.

Back to our cpu_metrics example, let’s say that we wanted to add a column named ‘location’ as its name states, defines where the sensor is.

Should we add it as a tag or a field?

tags-vs-fields

In our case, it would be added as a.. tag! We definitely want the location ‘column’ to be indexed and taken into account when performing a query over the location.

In general, I would advise keeping your measurements relatively small when it comes to the number of fields. More and more fields often rhyme with lower performance. You could create other measurements to store another field and index it properly.

Now that we’ve added the location tag to our measurement, let’s go a bit deeper into the taxonomy.

A set of tags is called a “tag-set”. The ‘column name’ of a tag is called a “tag key”. Values of a tag are called “tag values”. The same taxonomy repeats for fields. Back to our drawings.

Measurement taxonomy

Timestamp

Probably the simplest keyword to define. A timestamp in InfluxDB is a date and a time defined in RFC3339 format. When using InfluxDB, it is very common to define your time column as a timestamp in Unix time expressed in nanoseconds.

Tip: you can choose a nanosecond format for the time column and reduce the precision later by adding trailing zeros to your time value for it to fit the nanosecond format.

Retention policy

This feature of InfluxDB is for me one of the best features there is.

A retention policy defines how long you are going to keep your data. Retention policies are defined per database and of course, you can have multiple of them. By default, the retention policy is ‘autogen‘ and will basically keep your data forever. In general, databases have multiple retention policies that are used for different purposes.

How retention policies workWhat are the typical use-cases of retention policies?

Let’s pretend that you are using InfluxDB for live monitoring of an entire infrastructure.

You want to be able to detect when a server goes off for example. In this case, you are interested in data coming from that server in the present or short moments before. You are not interested in keeping the data for several months, as a result, you want to define a small retention policy: one or two hours for example.

Now if you are using InfluxDB for IoT, capturing data coming from a water tank for example. Later, you want to be able to share your data with the data science team for them to analyze it. In this case, you might want to keep data for a longer time: five years for example.

Point

Finally, an easy one to end this chapter about InfluxDB terms. A point is simply a set of fields that has the same timestamp. In a SQL world, it would be seen as a row or as a unique entry in a table. Nothing special here.

Congratulations on making it so far! In the next chapter, we are going to see the different use-cases of InfluxDB and how it can be used to take your company to the next level.

InfluxDB Use-Cases

Here is a detailed explanation of InfluxDB Use-Cases:

DevOps Monitoring

DevOps Monitoring is a very big subject nowadays. More and more teams are investing in building fast and reliable architectures that revolve around monitoring. From services to clusters of servers, it is very common for engineers to build a monitoring stack that provides smart alerts.

If you are interested in learning more about DevOps Monitoring, I wrote a couple of guides on the subject, you might find them relevant to your needs.

From the tools defined in section 1, you could build your own monitoring infrastructure and bring direct value to your company or start-up.

IoT World

The IoT is probably the next big revolution that is coming in the next few years. By 2020, it is estimated that over 30 billion devices will be considered IoT devices. Whether you are monitoring a single device or a giant network of IoT devices, you want to have accurate and instant metrics for you to take the best decisions regarding the goal you are trying to achieve.

Real companies are already working with InfluxDB for IoT. One example would be WorldSensing, a company that aims at expanding smart cities via individual concepts such as smart parking or traffic monitoring system. Their website is available here :

Industrial & Smart Plants

Plants are becoming more and more connected. Tasks are more automated than ever : as a consequence it brings an obvious need to be able to monitor every piece of the production chain to ensure a maximal throughput. But even when machines are not doing all the work and humans are involved, time-series monitoring is a unique opportunity to bring relevant metrics to managers.

Besides reinforcing productivity, they can contribute to building safer workplaces as they are able to detect issues quicker. Value for managers as well as for workers.

Your Own Imagination!

The examples detailed above are just examples and your imagination is the only limit to the applications that you can find for Time Series databases. I have shown it via some articles that I wrote, but time-series can be even used in cybersecurity!

If you have cool applications of InfluxDB or time-series database, post them as comments below, it is interesting to see what idea people can come up with.

Going Further

In this article, you learned many different concepts: what are time-series databases and how they are used in the real world. We have gone through a complete list of all the technical terms behind InfluxDB, and I am confident now to say that you are to go on your own adventure.

My advice to you right now would be to build something on your own. Install it, play with it, and start bringing value to your company or start-up today. Create a dashboard, play with queries, setup some alerts: there are many things that you will have to do in order to complete your InfluxDB journey.

If you need some inspiration to go further, you can check the other articles that we wrote on the subject: they provide clear step-by-step guides on how to setup everything.

4 Best Open Source Dashboard Monitoring Tools In 2021

In this digital world, every small and big organization is coming up with their best services in a website form for a good reach into the audience. The rise of their volume and value of the data growing very frequently. Are you a bit worried to get more value out of your data? Not anymore, switch to the dashboard technique where it serves as an important tool to monitor and control the situation within an organization.

While storing data in a time-series database, usually, you need to visualize and analyze it to have a more precise idea of trends, seasonalities, or unexpected changes that may be anomalies. This is when the open-source dashboard monitoring tools come into play.

In this tutorial, we are going to concentrate mainly on the 4 best open source dashboard monitoring tools in 2021 along with what is dashboard & dashboard software with their key aspects. However, we will also discuss what their qualities are, the industries they are linked to, and how they vary from each other.

What is Dashboard?

A dashboard is a tool that performs all administration KPIs (key performance indicators) and crucial data points at a particular place that assists in monitoring the strength of the business or department. The dashboard analyzes the complex data sets by making use of data visualization, which in turn supports users to gain knowledge of the current performance at a glance. The user can visualize data in the form of charts, graphs, or maps.

What is Dashboard Software?

Dashboard software serves as an automated tool that analyzes complex data sets and assists in revealing the patterns of data processing. With the help of dashboard management software, users can easily access, interact, and analyze up-to-date information at a centralized location. The usage of this technology is very huge, you can utilize it in different business processes like marketing, human resource, sales, and production. Mainly, it helps business people to monitor their business performance at a glance.

Also Check: 6 Tips To A Successful Code Review

Types of Dashboard

Present in the market, you can discover different dashboard types that are depending on where they are utilized like for large enterprises or for small-scale industries. The types of the dashboard are as follows:

  1. Tactical Dashboards: Managers who need a deeper knowledge of a company’s actions make use of it.
  2. Operational Dashboards: It is applied in sales, finances, services, manufacturing, and human resources.
  3. Strategic Dashboards: Senior executive uses this type to monitor the progress of the company striving to reach strategic goals.

How to find the perfect Dashboard?

By following these tips, we can easily discover the perfect dashboard for your firm or business:

  • Ease of Use
  • Customization
  • Scalability
  • Integration
  • Extendable
  • Modularity
  • Security Management
  • Exporting Options

Key Aspects of Dashboard Software

Remember that your dashboard software tool should include all required features for your business so that you can obtain the most out of your data:

  • Global Dashboard Filters
  • Dynamic Images
  • Multiple Sharing Options
  • Embedded Analytics
  • Dashboard tabs
  • Visual Representations
  • 24/7 Dashboard Access
  • Predefined Dashboard Templates
  • Printing Bounds
  • Public Links

What is an Open Source Dashboard Monitoring Tool?

Open source dashboard monitoring tools are designed to provide powerful visualizations to a wide variety of data sources. Often linked with time-series databases, they can also be linked with regular relational databases.

Advantages of Dashboard Management Software

The benefits of Dashboard Management Software are provided in the following shareable image:

advantages of dashboard software

Best Free Open Source Dashboard Monitoring Tools in 2021

The following four main free and open-source dashboard software tools provide high-quality options free of cost.

Check out the advantages, limitations, uses, and many more about them from the below modules:

1. Grafana

I – Grafana

Grafana is by far one of the most popular dashboard monitoring systems in use.

Released in 2013 and developed by Grafana Labs, Grafana plugs into a wide variety of data sources and provides a ton of panels to visualize your data.

One of the most common usages of Grafana is plugging into time series databases in order to visualize data in real-time. For certain panels, Grafana is equipped with an alerting system that allows users to build custom alerts when certain events occur on your data.

Gauges, world maps, tables, and even heatmaps are concrete examples of panels that you are going to find in Grafana.

New panels are released very frequently: as we write this article, Grafana just announced v6.2 which is shipping the brand new bar gauge panel.

As described previously, Grafana plugs to many different data sources: InfluxDB or Prometheus are examples of time series databases available; for relational databases, you can easily plug to MySQL or PostgreSQL databases (or TimescaleDB). Indexes are also available via the ElasticSearch connector.

Data sources

In my opinion, Grafana remains a reference for open-source dashboard monitoring. Their latest additions (such as the ‘Explore’ function or the new panels) emphasize their ambition to bring a global tool for monitoring, alerting, and analyzing data.

For curious developers, you can check Torkel Ödegaard’s great talk at GrafanaCon 2019 where he described Grafana’s roadmap and future projects.

2. Chronograf

II – Chronograf

Developed by InfluxData for many years, Chronograf is a solid alternative to Grafana when it comes to visualizing and exploring your data for InfluxDB data sources.

Chronograf exposes similar panels but there is one major difference with Grafana: Chronograf really focuses on exploring, querying, and visualizing data using InfluxQL and the Flux language. If you’re not familiar with what the Flux language is, you can check the article that I wrote that unveils the different capabilities of this new programming language.

So should you use Grafana or Chronograf?

In the end, it all comes down to your needs.

If you’re dealing a lot with InfluxDB in your infrastructure, then you should use Chronograf as it is specifically designed to handle InfluxDB databases.

On the other hand, if you have a variety of data sources, you should use Grafana. Those tools have similar abilities but Chronograf is more Influx-centered than Grafana.

Data sources 1

As Tim Hall mentioned in his “Chronograf – Present & Future” talk in InfluxDays 2018: the answer is to try both!

The UI aspect of Chronograf is very decent and modern: I think that you should try it at least once if you’re dealing with InfluxDB databases.

Would you link to see what a Chronograf dashboard look like? Head over to my ‘Monitoring systemd services in real-time using Chronograf‘ article!

3. Netdata

III – Netdata

Netdata is a tool that tracks performance and monitors health for a wide panel of systems and applications.

Netdata is configuration-based and runs as a daemon on the target machine.

Furthermore, Netdata is plugin-based.

When defining your daemon, you can choose from a panel of plugins that are either internal or external.

When you are set, there are two ways for you to retrieve and visualize data:

  • “Pull” method: you can set Netdata to run on individual nodes and plug your dashboards directly into it. This way, you can scale your node to your needs and you are not concerned about the scaling of different nodes. Also, storage is scoped to what’s really needed by a particular node thus more efficient;
  • “Push” method: Similar to what you would find in Prometheus with Pushgateway, you can ‘push’ metrics to a centralized place. You may find this handy for jobs that have a small lifespan such as batch jobs.

With Netdata, you can easily configure streaming pipelines for your data and replication databases.

This way, you can scale slave nodes depending on your needs and adapt to the actual demand.Data sources 2

Netdata’s website is available here: https://my-netdata.io/

4. Kibana

IV – Kibana

Any dashboard monitoring ranking wouldn’t be complete without mentioning Kibana.

Kibana is part of Elastic’s product suite and is often used in what we call an ELK stack: ElasticSearch + Logstash + Kibana.

You probably know ElasticSearch, the search engine based on the Lucene language.

If you’re unfamiliar with Elastic products, ElasticSearch provides a REST-based search engine that makes it fast and easy to retrieve data. It is often used in companies that are looking to speed up their data retrieval processes by providing fast interfaces to their end-users.

Logstash can be defined as a log pipeline. Similar to rsyslog, you can bind it to an extensive list of data sources (AWS, databases, or stream pipelines such as Kafka). Logstash will collect, transform data and insert it into ElasticSearch. Finally, Kibana will be used to visualize data stored in ElasticSearch.

Data sources 3

kibana

As you guessed it, Kibana is suited for log monitoring and has nothing to do with the direct network or DevOps monitoring (even if you could store logs related to servers or virtual machines!)

Wrapping Up

After referring to the above data, you get an idea of the best free and open-source dashboard monitoring tools. Now, it’s time for applying them to your company’s tech stack. Check out and analyze how do you plan on adding them to your company tech stack?

Well, are you utilizing them already? please let us know what were you able to accomplish with them? How did they specifically add value to your business?

Thank you for reading this article, I hope that you found it insightful. Until then, have fun, as always, and also visit our site for better knowledge on various technologies.

Best Software Engineering Books

The 10 Best Software Engineering Books in 2021 | Ten Must-Read Modern Software Engineering Books

Learning the subject from various modern world options like podcasts, videos, blogs, expert classes, etc. can be your wishlist but reading a good book is the final order where people enjoy & gain knowledge without any loss. Hence, find the best software engineering books & kickstart your learnings.

Discovering the top-most Software engineering textbooks in 2021 can be difficult for everyone. But people who have viewed our article can find it very easily and effortlessly. As we are going to give you a compiled list of the best books on software engineering subjects where recommended by a few experts.

Before going to review all these top 10 best software engineering books in 2021 that are available in this tutorial, we want to suggest you view and remember a few factors that help you select the right book for your further learnings. They are as fashioned:

  • High Recommendations
  • Editor Reviews
  • Hardcover/paperback
  • Pricing

This tutorial completely focuses on the best software engineering books available for software engineers, developers, and project managers.

Best New Software Engineering Books To Read in 2021

Software engineering is described as a process of analyzing user requirements and then designing, building, and testing software applications to fit those requirements. Guys who are beginners, or excited to learn coding, or expert ones can check the top 10 list of the best software engineering books 2021 below:

  1. Clean Code by Robert Martins
  2. Design Patterns: Elements of Reusable Object-Oriented Software by Eric Gamma
  3. Patterns of Enterprise Application Architecture by Martin Fowler
  4. Enterprise Integration Patterns by Gregor Hohpe
  5. The Mythical Man-Month by Frederick Brooks
  6. Code Complete by Steve McConnell
  7. Git for Teams by Emma Hogbin Westby
  8. Refactoring: Improving the Design of Existing Code by Martin Fowler
  9. The Art of Unit Testing by Roy Osherove
  10. Soft Skills: The Software Developer’s Life Manual by John Sonmez

1 – Clean Code by Robert Martins

1 – Clean Code by Robert Martins cleancode-final

Probably one of the greatest books about software engineering and programming. Every engineer, developer, or programmer should have read this book, at least one time.

In this book, Robert Martin provides clear and concise chapters about:

  • How to write high-quality and expressive code;
  • How to name your functions, your variables, essentially conveying your intent in your coding style;
  • How to unit test properly, why it matters, and how to do it properly;
  • How to choose relevant data structures and why they can make or break a piece of code;
  • How to write comments but most importantly how NOT to write comments;
  • How error handling works and how to properly engineer an exception handling workflow through your application or program

The book also provides real-life examples written in Java, so if you are familiar with object-oriented programming, that should not be an issue at all.

This book really helps to build code maturity. It actually helps you going from “How do I technically do this” to “How do I properly technically do this?” which is most of the time a neglected point by engineers.

Oh and for those who are wondering, what did the book from the introduction become?

I gave it to an aspiring Java engineer at my current job!

This book is ideal for junior developers and young software developers or engineers.

2 – Design Patterns: Elements of Reusable Object-Oriented Software by Eric Gamma

2 – Design Patterns Elements of Reusable Object-Oriented Software by Eric Gamma

This software engineering book is a great follow-up to the Clean code manual.

As Clean Code gives you the foundations of programming, Design Patterns teaches you recipes to write manageable and scalable code.

For small or large programs, thinking about how to design it from the get-go is one of the mandatory skills of a good software engineer.

Most of the time, when designing a project, you don’t have to reinvent the wheel. You can open your design pattern book and pick one that fits your needs.

From there you have the guarantee that your project will be able to scale, and you are also given tools to scale it properly.

As examples, here are some design patterns that are taught in the book (and that I use on a daily basis)

  • Abstract Factory: that lets you abstract object creation and decouples concrete objects from the business logic where they might be used;
  • Observer: builds links between objects that allow them to be notified when a certain event occurs in one of them. Very useful for real-time applications or in industrial programs;
  • Iterator: that enables developers to iterate on objects without knowing the implementation details of those data structures.

This book is really ideal for people willing to become either senior software engineers or solution architects.

Looking to master design patterns? Here’s where to get Design Patterns by Eric Gamma

3 – Patterns of Enterprise Application Architecture by Martin Fowler

3 – Patterns of Enterprise Application Architecture by Martin Fowler

Now that you know how to code, as well as how to design your code, it is time for you to know how to structure applications on an entreprise level.

Applications grow over time, and very often, they grow to a size that no one could have predicted.

However, you need to have concepts of entreprise architecture when you are building an application.

Are you correctly layering your application? If you are building a web application, are you aware of all the different presentational designs that you can choose from?

How are you accessing your data and how are you making sure that you are efficiently decoupling data from the applications that are trying to access them?

This book helps you master those concepts, and they can really play a big role in the life of an application.

This book, among other themes, teaches the following concepts :

  • How to organize your domain and your business logic in your application;
  • Techniques on how to access data in an application and how to build solid object-relational mappings for your databases;
  • How to handle concurrency in applications and what patterns to use to avoid deadlocks;
  • Web Presentations Patterns: MVC, MVVM, templates, are all equally useful in a world dominated by Javascript front-end frameworks.
  • Data source architectural patterns: how to efficiently architecture your application depending on the data source that is residing behind it.

4 – Enterprise Integration Patterns by Gregor Hohpe

4 – Enterprise Integration Patterns by Gregor Hohpe

Even if you are working for startups, it is very unlikely that you will write programs as standalone tools, without any dependencies to other applications or without even communicating with them.

Applications do exchange data, they share information and they need to communicate in reliable ways.

Think about it, if you are withdrawing money at an ATM, how many different servers and databases will be contacted for every operation that you perform?

Probably a lot. And it needs to be fast and secure.

Those are the concepts taught in the book :

  • What messaging patterns are and how they help to solve issues that were described right above;
  • How to design messaging systems properly;
  • An extensive list of individual messaging components (content-based router for example) that helps you build a complete architecture tailored to your needs;
  • Real-life examples of how a banking system for example would actually be designed.

With this book, you will definitely get to know more about the capabilities of what we call an engineering architect or an entreprise architect. 

Do you even own the book? I have my very own version of it!👽

Tip: for some of my interviews, I actually got asked questions related to concepts described in this book, especially how to handle system reliability in case of failure.

Probably one of the best software engineering books when it comes to system design.

5 – The Mythical Man-Month by Frederick Brooks

5 – The Mythical Man-Month by Frederick Brooks

If you are following the project management path of your engineering carrier, this is probably the book you should read.

The Mythical Man-Month discusses productivity, essentially tackling one of the myths that the time taken by one engineer can be equally divided if you hire more engineers to do the job.

This is of course false, and Frederick Brooks explains several project management concepts related to this myth :

  • Silver bullet concept: stating that there are no project management techniques able to solve current inherent problems of software development;
  • How to handle delay in project delivery and what role projects owners have to endorse when it comes to their clients;
  • How to communicate efficiently as a project leader, and what your team expects from you;
  • Most importantly, how to manage project iteration and how to prevent the “second-system” effect.

In software engineering, even with the best developers, most of the project success relies on being able to manage your team efficiently.

Project management is a whole different skill set, and you are trying to succeed in this field, this is probably the book you should read.

This project management masterpiece is available right here.

6 – Code Complete by Steve McConnell

6 – Code Complete by Steve McConnell

This book is seen as one of the references for software developers as it teaches all the basics that you should know in this field.

This is a very lengthy book, as it goes over 900 pages and sometimes in a lot of details.

With this book, you will cover :

  • How to code and how to debug: including how to write programs for people first, and for computers second;
  • Divide your code in terms of domains: the design of a high-level program is very different from the design (and implementation) of a low-level program;
  • Master human qualities of top coders: this is very big in an industry where everybody thinks it has the ultimate answer to a question. Build humility, curiosity, but most importantly, keep your ego in check;
  • Pick a process and stick to it: from the planning to the development, until the delivery, pick a process that guarantees project quality and prosperity.

7 – Git for Teams by Emma Hogbin Westby

7 – Git for Teams by Emma Hogbin Westby

For the seventh book, I chose a book about Git, the most used version control software in the world.

Why did I put this book in the list?

Because I believe that there can’t be a successful project without using version control, or without defining a good version control workflow.

If you are working alone, you may have not encountered issues that come with multiple people working on the same codebase at the same time.

However, without a proper workflow, the codebase can become quite a mess, and there is a very high chance that you will experience regressions.

This book teaches:

  • What git is and how to use the different commands efficiently.
  • How to define a custom git workflow for your team, given its size and what your project is about.
  • How to conduct code reviews and why they matter in software integration.
  • How to pick the best branching strategy for your team
  • How to define roles in your team, who should be a contributor, a reviewer, who manages the codebase, and so on.

Do you need a guide on how to conduct a code review? Here are the 6 best code review tips for you to know.

8 – Refactoring: Improving the Design of Existing Code by Martin Fowler

8 – Refactoring Improving the Design of Existing Code by Martin Fowler

As a software engineer, you spend a lot of time writing code and thinking about new algorithms in order to achieve your expected goal.

However, as your project grows, your codebase becomes larger and larger, you often find yourself writing duplicate functions, or having code parts that are very similar to one another.

As your project grows, you often feel like you are missing some points on function reusability and factorization. 

Refactoring by Martin Fowler is a book that helps you synthesizing and factorizing your codebase.

The book is built on study cases, focusing on seventy different refactoring cases.

On those seventy refactoring cases, Martin Fowler describes how to perform them properly, in a safe way for the code base, as well as the role of unit testing in refactoring.

9 – The Art of Unit Testing by Roy Osherove

9 – The Art of Unit Testing by Roy Osherove

A software engineering book list would not be complete without a book focused on unit testing.

Unit testing is not important, it is crucial and essential if you want to deliver a good and qualitative piece of software to the end-user.

Not every functionality or line of code has to be tested, but you have to provide a reasonable amount of unit tests for crucial parts of your codebase.

Unit tests save lives.

When your codebase is rather small, you can’t foresee the immediate benefits of having extensive unit test coverage.

However, as your codebase grows, sometimes you may want to tweak a small and harmless part of your code.

Harmless? Never. I speak from experience, even when I could swear that my modifications had no impacts on the software, in reality, they had huge impacts on existing functionalities.

The Art of Unit Testing provides core competencies on how to unit test, how to scope it, and what to unit test.

The chapters focus on :

  • What are the basics of unit testing, and how it differs from integration testing;
  • What are stubs and mocks in unit testing frameworks;
  • How to write loosely coupled unit tests in terms of dependencies;
  • Understanding isolation frameworks extensively;
  • How to work with legacy code from a testing perspective
Unit testing is crucial, and this is probably all you need to know to get your copy.

10 – Soft Skills: The Software Developer’s Life Manual by John Sonmez

10 – Soft Skills The Software Developer’s Life Manual by John Sonmez

I have followed John Sonmez from simpleprogrammer.com for a long time, and I respect John as an authoritative figure when it comes to soft skills designed for software engineers.

In a software engineering career, you spend most of your time coding, designing, and building software.

But as your responsibilities grow, you are sometimes given the opportunity to interact with clientsto gather their needs, or to actually showcase your advancement on its project delivery.

Interaction often means social skills, the ability to speak with confidence, the ability to choose the correct language given your audience, or the ability to negotiate.

Software engineering isn’t only about coding, it is also about maintaining a good work-life balance, having hobbies, exercising often, and eating properly.

Jon Sonmez helps you find and keep the right balance that you need to be an efficient and creative engineer, for a long time.

The books focus on:

  • Productivity tips: how to build the right habits for you to triple down your productivity;
  • Self-marketing tips: essentially how to sell yourself and how to increase your own perceived value;
  • Fitness tips: how working out correlates with a good and healthy software engineering career, how it can benefit you on a daily basis;
  • Financial advice: John explains how you can analyze your paycheck and make the best investments out of it.

Software engineering is not only about coding, get to know how to be more productive and have a great work-life balance.

Conclusion

Time to read and Time to practice are the best times to gain any knowledge you want.

Before ending this tutorial, there is one point that I want to make very clear when it comes to all the books.

True mastery comes from a reasonable amount of theory, and a tremendous amount of practice.

When practicing, you will get ten times more familiar with the concepts that you are reading about, and there are really no shortcuts to mastery in software engineering.

One of the greatest ways to keep learning when you are not at work, work on side projects!

Be patient, be humble, but also be confident that given the time, you will become a software engineer that delivers tools that really help people.

Experience is not taught in books. 

Until then, have fun, as always.

Docker Logs Complete Guide

Docker Logs Complete Guide | Definition of Docker Logs, Logging Strategies & Best Practices

It is very crucial for DevOps developers to keep their mind and soul in learning Docker Logs as they give insightful knowledge regarding what appeared on your container in case they crashed or if you want to monitor them.

Also, examining the Docker logs on a daily basis in your containerized environments is also essential for everyone learning about the Docker tool. Want to explore more about the main topic then just have a look at this ultimate Docker Logs Complete Guide entirely also find some of the best practices & docker logging strategies.

What Are Docker Container Logs?

On Docker, container logs can either be inspected by using the “logs” command or they can be stored on an external system (like Logstash or Syslog) in order to be analyzed later on.

When they are sent to an external system, you will need to have a logging driver installed for Docker to send its container logs.

Some particularities may exist depending on the image used.

One good example is the NGINX image actually redirecting access and error logs to some specific devices on your Linux system (/dev/stdout and /dev/stderr).

Similarly, the Apache Web Server will redirect the logs directly to specific file descriptors (/proc/self/fd/1) on your system.

However, in most cases, using the “logs” command is enough.

Where are Docker logs?

When it comes to Docker logs, you either want to inspect your container logs or the logs for the Docker daemon.

Do Refer: 

Docker Logging Strategies and Best Practices

One of the biggest challenging tasks on docker is logging. So, to handle it very easily we have compiled a few best practices of docker logging that you should memorize while working with containerized applications. These Docker logging best practices are listed in a shareable image to pass on to everyone easily:

Docker logging best practices

Docker Daemon Logs

On the other hand, the Docker daemon is also producing some logs for you to inspect.

Depending on the system you are running Docker on, you will find the Docker daemon logs in different places :

  • /var/log/daemon.log : for Debian distributions;
  • /var/log/messages : for RHEL and Oracle Linux;
  • journalctl -u docker.service: for Ubuntu 16.04+ and CentOS 7/8
  • /var/log/upstart/docker.log : for Ubuntu distributions still using upstart;
  • AppData/Local: for Windows operating systems;

As a small example, if you installed Docker on Ubuntu or Debian, you would run this command to inspect your Docker daemon logs.

$ tail -f -n 1000 /var/log/daemon.log | grep --color docker

Alternatively, if you are using systemd to manage your services, you can inspect Docker daemon logs with the journalctl command.

$ sudo journalctl -u docker.service | less

View Docker Logs using the logs option

In order to view and inspect logs on Docker, you have to use the “docker logs” command with custom options.

$ docker logs <container_id>

$ docker logs <container_name>

For example, in order to see the Docker logs from a Grafana server started from a Docker image, you would run

$ docker logs grafana

View Docker Logs using the logs option docker-logs-container

View Docker logs since a specific date

When you are inspecting your Docker logs, you often want to limit the output to a given number of lines, not to be flooded with information.

In order to view Docker logs since a specific date or duration, use the “–since” option with a date or a duration.

For example, to see Docker container logs for 10 minutes, you would write

$ docker logs --since 10m <container_id>

You can also write a date format as long as it is provided in ISO format

$ docker logs --since 2019-10-20T10:00:00 <container_id>

Note that the logs will be shown given the current date of your system and not the date of the Docker logs.

View Docker logs until a specific date

Similar to the since option, you can choose to inspect your container logs until a specific date.

You can also specify absolute dates (like an ISO date for example) or relative like 10 minutes, 30 minutes or 50 minutes.

To view logs until a specific date, use the “–until” option with a date or a duration.

$ docker logs --until 10m <container_id>

You can also provide a date format like you did before for the since option.

$ docker logs --until 2019-10-20T10:00:00 <container_id>

Tail Docker Logs using the tail option

In some cases, you want to restrict the number of lines printed on your screen from the Docker logs.

In order to achieve this result, you will have to use the “–tail” option in the following way.

$ docker logs --tail <number> <container_id|name>

For example, in order to show 100 lines from your Grafana for Docker logs, you will have to write

$ docker logs --tail 100 grafana

$ docker logs --tail 100 4921d714d338

Exporting Docker Logs using logging drivers

In some cases, you may want to export your Docker logs in order to analyze them later on.

For simple debugging needs, having the logs printed to stdout or stderr is enough.

However, if you plan on running a more complex analysis, you will need to have them stored in logging systems such as Syslog or Logstash.

This is where the concept of logging drivers comes into play.

What are logging drivers?

In Docker, logging drivers are a set of custom plugins that one can activate or install in order to export logs to an external tool such as syslog, Logstash, or custom datasources.

For example, you can choose to export your Docker logs to :

  • syslog: Docker will write its logs to the syslog daemon. Later on, those logs can be centralized and analyzed in an external system such as Kibana;
  • journald: on modern distributions, journald is the default logging option. As a consequence, Docker can export logs to it;
  • gelf: for administrators using Graylog and the GELF (Graylog Extended Log Format) format;
  • awslogs: in order to export logs to Amazon CloudWatch Logs;
  • none: if you choose not to have logs for your containers;
  • etwlogs: used to write logs to the Event Tracing for Windows;
  • fluentd: in order to write Docker logs to the fluentd daemon;
  • local: in order to store logs in a minimal format.

Now that you have an idea about logging drivers, you might be wondering what logging driver you are currently using on your system.

To find the default logging driver used in Docker, use the “docker info” command.

$ docker info | grep Logging
  Logging Driver: json-file

In most instances, the default logging driver is “json-file” unless you already modified this parameter before.

Defining a default logging driver

In order to define a default logging driver on Linux, you will need to overwrite the log-driver option located in your daemon.log configuration file.

The daemon.log file is located in the /etc/docker configuration folder on your system.

If the “daemon.log” is not existing, make sure to create it and paste the following content in it.

{
  "log-driver": "syslog"
}

Those default settings will be applied whenever you create a new container.

However, you can also create containers with “docker run” and specify the logging driver to be used instead of the default one.

Save your file and restart your Docker service for the changes to be applied.

$ sudo systemctl restart docker
$ sudo systemctl status docker

Finally, run the “docker info” command again in order to check if your logging preferences were changed.

$ docker info | grep Logging
  Logging Driver: syslog

In order to inspect the logs, you will have to navigate to the default log location on Linux : /var/log

By default, your Docker daemon will send its logs to the daemon.log in /var/log.

In order to see the logs associated to the Docker daemon, you can run the following command

$ sudo tail -f daemon.log | grep docker

However, note that defining the default logging driver does not imply that your containers will automatically send their logs to the source you specified.

Redirecting container logs to syslog

In order to make sure that logs are correctly redirected, you have to inspect your containers and the logging driver associated with them.

$ docker inspect <container_id|container_name> | grep -A 5 LogConfig

"LogConfig": {
  "Type": "syslog"
  "Config": {}
}

As you can see, the logging driver is defined to syslog, but what if I used an old container using another logging driver?

To redirect container logs to syslog, you have two options :

  • Creating another container, making sure that you defined the logging driver in the previous section
  • Run “docker run” and specify the logging driver that you want to use.

To define the logging driver for a container, you have to use “docker run” with the “–log-driver” option.

$ docker container run -it -d --log-driver syslog <image>

Then, make sure that your logging driver was correctly set by running the inspect command again.

$ docker inspect <container_id|container_name> | grep -A 5 LogConfig

In order to view Docker logs, you have to inspect the “daemon.log” file and search for your container id.

$ sudo tail -f -n1000 daemon.log | grep <container_id>

Redirecting container logs to syslog daemon-log

Redirecting container logs to journald

On modern distributions, there is also a way to inspect system logs: by using the journald utility from the systemd environment.

Some administrators may prefer to have Syslog in order to implement a centralized logging system for example.

Others may choose to have journald because of the handy commands it exposes.

In order to redirect container logs to journald, you can either define it in the daemon.log configuration or you can specify it at runtime with the “–log-driver” option.

$ docker container run -it -d --log-driver journald <image>

Next, verify that your logging driver was correctly set for the container.

$ docker inspect <container_id|container_name> | grep -A 5 LogConfig

"LogConfig": {
  "Type": "journald"
  "Config": {}
}

In order to inspect logs sent to journald, you have to run the following command

$ sudo journalctl CONTAINER_NAME=<container_name>

For example, for a container named “mycontainer”, you would run

$ sudo journalctl CONTAINER_NAME=mycontainer<

Redirecting container logs to journald blob

As you can see, this is not very handy as the data shown in the journal is not fully displayed.

To avoid having “blob data” presented when running journalctl, append the “–all” option to your command.

$ sudo journalctl --all CONTAINER_NAME=mycontainer

Redirecting container logs to journald grafana

Great!

You successfully exporter your Docker container logs to journald.

View Docker Compose Logs

In order to inspect Docker Compose logs, you can also run a simple command to have them shown on the standard output.

$ docker-compose logs

You can also choose to have the logs displayed for one service and not for your entire Docker Compose stack.

$ docker-compose logs <app>

Note that the options detailed before are also available using docker-compose.

For example, if you want to have only 100 lines of logs written for your service in docker-compose, you would write

$ docker-compose logs --tail 100 <app>

Conclusion

In this tutorial, you learned more about Docker logs and how they can be inspected, and how you can use options in order to monitor them.

You also learned about logging drivers and how they can be used in order to export Docker logs to an external logging system such as Syslog or journald.

If you are curious about Linux logging, we have a complete section on the website dedicated to Logging.

How To Install Docker on Windows 7 8 10 Home and Pro

How To Install Docker on Windows 7/8/10 Home and Pro | Docker for Windows 10 Home Tutorial for Beginners

Have you wondered initially what is docker? Docker is a computer program that functions Operating-system-level Virtualization, also called “containerization”. Whenever the containers made with docker permit you to create an isolated development environment on your system. You can find various benefits of docker from the official docker website or else from our docker tutorials.

For performing any of the tasks related to docker, firstly, you need to install docker on your windows version. If your windows version is 7/8/9 then you should download and install the Docker toolbox.

Do you want to know what the docker toolbox means, how to install the docker desktop on windows, what do you need for installation, installation instructions, and many more? checking out this entire How To Install Docker on Windows 7/8/10 Home and Pro Tutorial is the perfect solution.

What is meant by Docker?

Docker is the most popular virtualization platform available by far and it was founded in 2010 by Solomon Hykes. Software engineers make use of this docker platform widely for DevOps operations like continuous development and deployment purposes. Also, Docker attains as a reference for managing, deploying, and running applications all over the world.

What is Docker Toolbox?

Docker Toolbox is for older Mac and Windows systems that do not meet the requirements of Docker for Mac and Docker for Windows. Docker Toolbox automatically performs a Linux VM on VirtualBox that hosts Docker on your Windows system.

Prerequisites

First of all, you want to determine the current version of Windows running on your computer.

Get your current Windows version

Installations are different between the Windows Pro Edition and the Windows Home Edition as Windows Home does not ship the Hyper-V feature (necessary to run “Docker for Windows”)

To determine your current Windows version, open your control panel.

a – Get your current Windows version control-panel

Click on System and Security, and you should see this panel.

a – Get your current Windows version system

Click on the System option, and you should be able to see your system version.

As you can see, I am running Windows 10 Pro (or Enterprise), so I will be able to install Docker Desktop for Windows.

If you are running Windows 7/8 or 10 Home, you should install the Docker Toolbox.

windows-10-pro-2

Verify virtualization is enabled on Windows

In order to verify that virtualization is enabled on Windows, press Ctrl + Alt + Del and head over to the “Performance” panel.

On this panel, you should see the Virtualization option.

Make sure virtualization is enabled.

virtu-enabled

Docker heavily relies on virtualization, making it impossible to run Docker if this option is not enabled on your computer.

If you need to enable Windows virtualization, you can follow this tutorial.

Steps to Install Docker on Windows 7/8/10 Home

First, we are going to see how you can install Docker for computers that do not have the Hyper-V feature available.

For those computers, you are going to need Docker Toolbox.

a – Download the Docker Toolbox executable

First of all, head over to the official Docker Toolbox repository on Github and download the latest executable available.

At the time of this tutorial, version v19.03.1 is available.

Click on the executable available.

As you can see, the Docker Toolbox comes with multiple executables:

  • Docker: the docker binaries available to create and run containers on your computer. When installing Docker, you get a Docker CLI for you to communicate with a Docker server. This way, you can launch instructions and they will be executed on your containers;
  • Docker-machine: a tool that handles provisioning on your containers (installing packages, deleting packages, running them, etc.);
  • Docker-compose: a tool for environments containing multiple containers with different environments. This way, you can start multiple containers together, or stop them together;
  • Kitematic: a sweet graphical interface for you to control your containers on Windows and Mac;
  • Boot2Docker ISO: a tiny Linux distribution for you to run Docker on Windows;
  • VirtualBox: open-source hypervisor for Windows and used to emulate operating systems on your Windows system.

a – Download the Docker Toolbox executable docker-toolbox-exe

Save your executable somewhere appropriate, and run it to install Docker on Windows.

b – Run the Docker Toolbox installer for Windows.

First, this is what you should see when running the executable on Windows.

step-1-toolbox

Click on Next.

For the second screen, choose a location where to store your Docker files, and click on Next.

step-2-toolbox

Select the full installation on Windows, and check the Git for Windows option if not already installed on your computer.

If VirtualBox is already installed on your computer, you can uncheck this option (it won’t get reinstalled if you let the checkbox be checked)
step-3-toolbox

Click on Next.

For the additional tasks, you can let the default options and click on Next.

step-4-toolbox

Finally, click on Install to start the Docker Toolbox installation.

step-5-toolbox

After a short while, your installation should be complete. Leave the checkbox checked in order to see the shortcuts created by Docker.

step-6-toolbox

c – Run the Docker Quickstart for Windows

Now that Docker is installed, you are going to run the Docker quickstart process.

shortcuts

Double-click on the icon to start Docker Quickstart.

A terminal shell opens and starts running some commands on your computer to setup Docker properly. This setup step will create a VirtualBox VM using the Boot2Docker ISO downloaded.

docker-quickstart-step-1

Wait a few moments for the setup to complete.

After some moments, you should see Moby (the whale of Docker!), meaning that your installation was successful.

docker-toolbox-exe-2

To verify your current Docker version, run the following command

$ docker version

docker-version-1

Awesome!

You have successfully installed Docker on Windows 7/8 and 10 Home.

Steps to Install Docker on Windows 10 Pro and Enterprise

Windows 10 has the Hyper-V feature available, so we are going to install the Docker Desktop version that includes the Docker Community Edition for Windows.

a – Check your virtualization settings

First, we are going to check if Hyper-V is enabled on your machine. If not, you will have to enable it.

In the Windows search menu, type “Type Windows Features On and Off“, and select it.

a – Check your virtualization settings turn-windows-features

A window similar to this one should appear. Make sure that the Hyper V checkbox is enabled.

hyper-v-2

Restart your computer for the changes to be applied.

Nice!

Now let’s download Docker Desktop for Windows.

b – Create an account on Docker Hub

In order to download Docker Desktop, you are going to need a Docker Hub account.

Head over to the Docker Hub sign-up page, and create a new account.

docker-sign-up

Click on “Continue“.

On the next screen, fill up the information needed, and click on “Continue”.

sign-up-2

On the next screen, you are asked to verify your email. Make sure to check your inbox and to click on the verify link from Docker Hub.

check-inbox

As an example, this is the email that I received from Docker.

confirm-email

Click on “Confirm your email with Docker”, and this is what you should see.

verif-success

Click on “Go to Sign In” and sign in using the credentials you specified before.

sign-in-docker

Great! Now let’s download Docker Desktop for Windows.

c – Install Docker Desktop for Windows

In order to download Docker Desktop, head over to this page, and click on “Get Docker“.

c – Install Docker Desktop for Windows get-docker

Your browser should start download the executable file. When the download is done, click on it to start the Docker Desktop installation for Windows.

exec-1

Make sure that the executable is coming from “Docker Inc” and click on “Run”.

Initially, the Docker Desktop installer should start download some packages. This is completely normal, just wait a couple of seconds until it is done.

exec-2

When it is done, just leave the default options on the next screen, unless you want to use Windows containers in the future.

exec-3

Right after, Docker will start unpacking some files. Just wait a couple of seconds until it is done.

Finally, click on “Close and Log Out”. Make sure that you don’t have any unsaved work or important programs running in the background.
exec5
When signing back in, this is what you should see at the bottom right corner of your desktop.
exec6
Now that Docker Desktop is running, open a Powershell console and check your Docker version.
docker-version-powershell

Great, as you can see I am now running the latest stable version of Docker on my Windows 10 Pro.

d – Configuring Docker Desktop

Before using Docker Desktop for Windows 10 Pro, you may need to do some quick configuration steps for it to run as smoothly as possible.

Sharing Drives

At the bottom right corner of your screen, click on the Docker icon and select “Settings”.

Settings-docker-desktop

On the “Shared drives” section, make sure to enable some of your hard drives if you plan on writing code on them and running it inside Docker.

This can be useful in case you plan on mapping volumes for example to Docker containers. Without checking those hard drives, you might not be able to do it.
shared-drives
In my case, I will share the C: drive on my computer and click on “Apply”.
docker-share-filesystem

Docker will need to access your computer’s filesystem in order to share drives. Simply enter your account password and click on “Ok”.

Customize Docker resources

In the “Advanced” tab, make sure that you are allocating the right amount of resources to Docker for it to run smoothly.

Those are the parameters set by default but you may need to have higher specifications if Docker is running badly.

advanced-tab

Great! You learned how to install Docker Desktop on Windows 10 Pro.

Conclusion

In this tutorial, you learned how to install Docker Toolbox and Docker Desktop for the latest versions of Windows.

Now that you have a complete Docker setup, it is time for you to run your first container.

Have a look at this video in order to create your first Docker container.

How To Checkout Git Tags

How To Checkout Git Tags | How Do You Checkout Latest Git Tag Easily?

In Git, tags are references that point to a specific point in time and are commonly used to identify release versions of your code. When you are working with Git, it is necessary to build tags to ought reference points in their development.

Tags are utilized to mark specific commits in Git, e.g. release versions. While a branch pointer moves at additional commits are made, a tag remains set on the specified revision.

Moreover, tags are Git objects indicating that they can be checked out like you would check out a branch or a commit for instance. In this short tutorial, we will be discussing how to checkout a tag in Git easily. Along with this, you can also take a look at the checkout of the latest git tag with the help of Git Commands.

Checkout Git Tag using ‘git checkout’ command

To checkout, a Git tag, use the “git checkout” command and specify the tag name as well as the branch to be checked out.

$ git checkout tags/<tag> -b <branch>

Note that you will have to make sure that you have the latest tag list from your remote repository.

To fetch tags from your remote repository, use “git fetch” with the “–all” and the “–tags” options.

$ git fetch --all --tags

Fetching origin
From git-repository
   98a14be..7a9ad7f  master     -> origin/master
 * [new tag]         v1.0       -> v1.0

Let’s say for example that you have a tag named “v1.0” that you want to check out in a branch named “release”.

To achieve that, you would execute the following command

$ git checkout tags/v1.0 -b v1.0-branch

Switched to a new branch 'v1.0-branch'

Using this command, you have successfully checked out the “v1.0” tag.

You can inspect the state of your branch by using the “git log” command. Make sure that the HEAD pointer (the latest commit) is pointing to your annotated tag.

$ git log --oneline --graph

* 53a7dcf (HEAD -> v1.0-branch, tag: v1.0) Version 1.0 commit
* 0a9e448 added files
* bd6903f (release) first commit

Awesome!

Now you can start working on your branch starting from the tag you specified earlier.

Checkout latest Git tag

In some cases, you may be interested in checking out the latest Git tag of your repository.

To check out the latest Git tag, first, update your repository by fetching the remote tags available.

$ git fetch --tags

Fetching origin
From git-repository
   98a14be..7a9ad7f  master     -> origin/master
 * [new tag]         v2.0       -> v2.0
 * [new tag]         v1.0       -> v1.0

As you can see, you retrieve multiple tags from your remote repository.

Then, retrieve the latest tag available by using the “git describe” command.

$ tag=$(git describe --tags `git rev-list --tags --max-count=1`)

$ echo $tag
v2.0

Finally, use the “git checkout” command to checkout the latest git tag of your repository.

$ git checkout $tag -b latest

Switched to a new branch 'latest'

That’s it! You have successfully checkout the latest Git tag available in a new branch.

You can execute the “git log” command to make sure that you are actually developing starting from the new tag.

$ git log --oneline --graph

* 7a9ad7f (HEAD -> latest, tag: v2.0, origin/master, master) version 2 commit
* 98a14be Version 2 commit
* 53a7dcf (tag: v1.0, v1.0-branch) Version 1.0 commit
* 0a9e448 added files
* bd6903f (branch3) first commit

Conclusion

In this tutorial, you have seen how you can easily checkout tags on Git using the “git checkout” command. Also, we have covered the information about checking out the latest Git tags from your repository in case you have multiple tags.

Interested in Git tags? Check our guide on how to delete local and remote git tags.

How To Add and Update Git Submodules

How To Add and Update Git Submodules | Definition of Submodule

If you are developing a large project then you need to be familiar with this important concept called Git submodules. Git submodules permit you to have a git repository as a subdirectory of different git repositories. Just these are a reference to another repository at a particular snapshot in time.

Do Check: GIT Commands

Also, Git submodules allow a Git repository to incorporate another versioned project within an existing project and track the version history of external code. In this tutorial, we are discussing how easily add, update and remove Git submodules on your main project can be done. Apart from this, we will describe concepts about Git submodules

What is a Submodule?

A Submodule is a Git Repository inside another Git Repository. This embedded Git Repository can be run separately and will have its individual Git workflow. This embedded repository can also be used as a Submodule for various other repositories without generating new files from scratch for each repository.

When should you use a git submodule?

By using the Git submodules, you can easily maintain strict version management over your external dependencies. The furnished points are some of the best use cases for git submodules:

  • When you have a component that isn’t updated very often and you want to track it as a vendor dependency.
  • When an external component or subproject is changing too fast or upcoming changes will break the API, you can lock the code to a specific commit for your own safety.
  • When you are delegating a piece of the project to a third party and you want to integrate their work at a specific time or release. Again this works when updates are not too frequent.

Do Refer: How To Create and Apply Git Patch Files

Add a Git Submodule

The first thing you want to do is to add a Git submodule to your main project.

In order to add a Git submodule, use the “git submodule add” command and specify the URL of the Git remote repository to be included as a submodule.

Optionally, you can also specify the target directory (it will be included in a directory named like the remote repository name if not provided)

$ git submodule add <remote_url> <destination_folder>

When adding a Git submodule, your submodule will be staged. As a consequence, you will need to commit your submodule by using the “git commit” command.

$ git commit -m "Added the submodule to the project."

$ git push

As an example, let’s pretend that you want to add the “project” repository as a submodule on your project into a folder named “vendors”.

To add “project” as a submodule, you would run the following command at the root of your repository

$ git submodule add https://github.com/project/project.git vendors

Cloning into '/home/user/main/project'...
remote: Enumerating objects: 5257, done.
remote: Total 5257 (delta 0), reused 0 (delta 0), pack-reused 5257
Receiving objects: 100% (5257/5257), 3.03 MiB | 3.38 MiB/s, done.
Resolving deltas: 100% (3319/3319), done.

When adding a new Git submodule into your project, multiple actions will be performed for you:

  • A folder is created in your Git repository named after the submodule that you chose to add (in this case “vendors”);
  • A hidden file named “.gitmodules” is created in your Git repository: this file contains the references to the remote repositories that you cloned as submodules;
  • Your Git configuration (located at .git/config) was also modified in order to include the submodule you just added;
  • The submodule you just added is marked as a change to be committed in your repository.

Add a Git Submodule add-submodule-1

Pull a Git Submodule

In this section, we are going to see how you can pull a Git submodule as another developer on the project.

Whenever you are cloning a Git repository having submodules, you need to execute an extra command in order for the submodules to be pulled.

If you don’t execute this command, you will fetch the submodule folder, but you won’t have any content in it.

To pull a Git submodule, use the “git submodule update” command with the “–init” and the “–recursive” options.

$ git submodule update --init --recursive

Going back to the example we described before: let’s pretend that we are in a complete new Git repository created by our colleague.

In its Git repository, our colleague first starts by cloning the repository, however, it is not cloning the content of the Git submodule.

To update its own Git configuration, it has to execute the “git submodule update” command.

$ git submodule update --init --recursive

Submodule 'vendors' (https://github.com/project/project.git) registered for path 'vendors'
Cloning into '/home/colleague/submodules/vendors'...
Submodule path 'vendors': checked out '43d08138766b3592352c9d4cbeea9c9948537359'

As you can see, pulling a Git submodule in our colleague Git repository detached the HEAD at a given commit.

The submodule is always set to have its HEAD detached at a given commit by default: as the main repository is not tracking the changes of the submodule, it is only seen as a specific commit from the submodule repository.

Steps on how to Update Git Submodules

For updating the Git submodules in your workspace with the latest commits on the server please follow the below steps carefully:

  • Clone the remote repository, if you haven’t already.
  • Issue a git submodule update –remote command.
  • Add any new files pulled from the repository to the Git index.
  • Perform a git commit.
  • Push back to origin.

Update a Git Submodule

In some cases, you are not pulling a Git submodule but you are simply looking to update your existing Git submodule in the project.

In order to update an existing Git submodule, you need to execute the “git submodule update” with the “–remote” and the “–merge” option.

$ git submodule update --remote --merge

Using the “–remote” command, you will be able to update your existing Git submodules without having to run “git pull” commands in each submodule of your project.

When using this command, your detached HEAD will be updated to the newest commit in the submodule repository.

Given the example that we used before when updating the submodule, we would get the following output:

$ git submodule update --remote --merge

Updating 43d0813..93360a2
Fast-forward
 README.md | 6 +++++-
 1 file changed, 5 insertions(+), 1 deletion(-)
Submodule path 'vendors': merged in '93360a21dc79011ff632b68741ac0b9811b60526'

Git Submodules Update Example

For executing the update git submodules example on your local machine, you can make use of the following commands:

submodule@example:~$ git clone --recurse-submodules https://gitlab.com/cameronmcnz/surface.git
submodule@example:~$ cd sur*
submodule@example:~$ git submodule update --remote
submodule@example:~$ git add .
submodule@example:~$ git commit -m "git submodule updated"
submodule@example:~$ git push origin

Fetch new submodule commits

In this section, you are looking to update your Git repository with your commits coming from the submodule repository.

First, you may want to fetch new commits that were done in the submodule repository.

Let’s say for example that you want to fetch two new commits that were added to the submodule repository.

To fetch new commits done in the submodule repository, head into your submodule folder and run the “git fetch” command first (you will get the new submodule commits)

$ cd repository/submodule 

$ git fetch

Now, if you run the “git log” command again, you will be able to see the new commits you are looking to integrate.

$ git log --oneline origin/master -3

93360a2 (origin/master, origin/HEAD) Second commit
88db523 First commit
43d0813 (HEAD -> master) Initial commit

Now, in order for your submodule to be in line with the newest commits, you can run the “git checkout” command and specify the SHA that you want to update your submodule to (in this case 93360a2)

$ git checkout -q 93360a2

Great! Your HEAD is now aligned with the newest commits from the submodule repository.

You can now go back to your main repository and commit your changes for other developers to fetch those new commits.

$ cd repository

$ git add.

$ git commit -m "Added new commits from the submodule repository"

$ git push

Remove Git submodules

In this section, we are going to see how you can effectively remove a Git submodule from your repository.

In order to remove a Git submodule from your repository, use the “git submodule deinit” command followed by the “git rm” command and specify the name of the submodule folder.

$ git submodule deinit <submodule>

$ git rm <submodule>

When executing the “git submodule deinit” command, you will delete the local submodule configuration stored in your repository.

As a consequence, the line referencing the submodule will be deleted from your .git/config file.

The “git rm” command is used in order to delete submodules files from the working directory and remaining .git folders.

Configuring submodules for your repository

In some cases, you may want to have additional logging lines whenever you are executing “git status” commands.

Luckily for you, there are configuration properties that you can tweak in order to have more information about your submodules.

Submodule summary

In order to have a submodule summary when executing “git status”, execute the “git config” command and add the “status.submoduleSummary” option.

$ git config --global status.submoduleSummary true

As a consequence, you will be presented with more information when executing “git status” commands.

$ git status
On branch master
Your branch is up-to-date with 'origin/master'.
Changes to be committed:
  (use "git reset HEAD <file>..." to unstage)

  new file:   .gitmodules
  new file:   <submodule>

Submodule changes to be committed:

* <submodule> 0000000...ae14a2 (1):
  > Change submodule name

Detailed diff for submodules

If you configured your Git to have the submodule summary as explained in the previous section, you should now have a customized way to see the differences between submodules.

However, in some cases, you want to get more information about the commits that might have been done in your submodules folder.

For the “git diff” command to have detailed information about your submodules, use the “git config” command with the “diff.submodule” parameter set to true.

$ git config --global diff.submodule log

Now, whenever you are executing the “git diff” command, you will be able to see the commits that were done in the submodules folder.

$ git diff

Submodule <submodule> 0000000...ae14a2:
  > Submodule commit n°1
  > Submodule commit n°2

Conclusion

In this tutorial, you learned what submodules are and how you can use them in order to have external repositories in your main project repository. Also, more about how to add and update Git submodules using the dedicated “git submodule” commands: “git submodule add” and “git submodule update“.

Finally, you have seen that it is possible to tweak your Git configuration in order to get more information about your Git repository.

How To Set Upstream Branch on Git

How To Set Upstream Branch on Git | What is a Git Upstream Branch? | Git Set Upstream Branch without Push

Once you clone a Git repository or build new features via branches, you should have an idea about how set-upstream branches and work properly.

This tutorial helps you all in learning what are upstreams, what is git upstream branch, how to set up a Git upstream branch, how to change it, and how to have an overview of which Git branch is tracking which upstream branch.

Do Refer: Git Commands 

However, while creating a new branch, or when working with existing branches, it can be pretty useful to know how to set upstream branch in Git.

What are Upstreams?

Upstream branches specify the branch tracked on the remote repository via your local remote branch (known as a remote-tracking branch). It is also closely connected with remote branches. Usually, upstream is from where you clone the repository.

What is a Git Upstream Branch?

Using a river analogy to explain the flow of data, upstream is transmitting your data back to where the river stream is originating from. When you transfer something upstream, you are transferring it back to the original authors of the repository.

By git set-upstream, you can determine where your current local branch will flow. It lets you change the default remote branch.
How To Set Upstream Branch on Git upstream

Prerequisites

  • Git installed and configured
  • A cloned Git repository or your own Git project set up locally

Also Read: How To Install Git On Debian 10 Buster

Why are upstream branches so useful in Git?

Upstream branches are beneficial because:

  • You get references to your remote repositories and you essentially know if you are ahead of them or not.

When performing a “git fetch” command, you can bring the new commits from your remote repository and you can choose to merge them at will.

  • You can perform pull and push easily

When you set your upstream (or tracking) branches, you can simply execute pulls and pushes without having to specify the target branch.

Git automatically knows that it has to fetch the new commits to the remote-tracking branch. Similarly, Git already knows that it has to push new commits to the upstream branch.

But where does Git keep a reference of the upstream branches associated with local branches?

Git keeps references to upstream branches via its config file in the “.git” directory.

How to Set Upstream Branch in Git?

Mainly, you can see two methods to set an upstream branch on git. They are as follows:

  1. With git push: This is the fastest way to set a single upstream branch
  2. With a short alias command: It makes a lot of sense if you frequently change the flow of your current branch.

Set upstream branch using git push

The most straightforward & fastest way to set the upstream branch is to use the “git push” command with the “-u” option for an upstream branch.

$ git push -u <remote> <branch>

Alternatively, you can use the “–set-upstream” option that is equivalent to the “-u” option.

$ git push --set-upstream <remote> <branch>

As an example, let’s say that you created a branch named “branch” using the checkout command.

$ git checkout -b branch
Switched to a new branch 'branch'

You can check tracking branches by running the “git branch” command with the “-vv” option.

$ git branch -vv
* branch  808b598 Initial commit
 master  808b598 [origin/master] Initial commit

As you can see, compared to master, the branch “branch” has no tracking branches yet (and no upstream branches as a consequence)

We can set the upstream branch using the “git push” command.

$ git push -u origin branch
Total 0 (delta 0), reused 0 (delta 0)
 * [new branch]      branch -> branch
Branch 'branch' set up to track remote branch 'branch' from 'origin'.

Let’s have a look at the tracking branches again with the branch command.

$ git branch -vv
* branch  808b598 [origin/branch] Initial commit
master  808b598 [origin/master] Initial commit

Great!

We have successfully set the upstream branch for our newly created branch.

Set upstream branch using an alias

Another way to set the upstream branch is to define an alias for your “git push” command.

In fact, pushing to HEAD is equivalent to pushing to a remote branch having the same name as your current branch.

$ git push -u origin HEAD

In order to avoid having to define the upstream every time you create a new branch, define an alias for the command we just wrote.

For aliases, you have two choices, you can either create a git alias or a bash alias.

Using a git alias

In order to create a new git alias, use the “git config” command and define a new alias named “pushd”

$ git config --global alias.pushd "push -u origin HEAD"

When you are done adding and committing fiels to your repository, set the upstream branch using your newly defined alias.

$ git pushd
Total 0 (delta 0), reused 0 (delta 0)
 * [new branch]      HEAD -> branch
Branch 'branch' set up to track remote branch 'branch' from 'origin'.

Using a bash alias

Alternatively, you can use a bash alias if you don’t want to modify your existing git commands.

Define a new bash alias using the “alias” command and define a name for it.

$ alias gp='git push -u origin HEAD'

Let’s create a new branch and use our alias in order to push our code and create the upstream branch easily.

$ git checkout -b branch2
Total 0 (delta 0), reused 0 (delta 0)
 * [new branch]      HEAD -> branch2
Branch 'branch2' set up to track remote branch 'branch2' from 'origin'.

Set upstream branch for an existing remote branch

In some cases, you may choose to link your local branches to existing remote branches that you just pulled or cloned from the main repository.

Let’s say for example that you pulled the “dev” branch located on the “origin” remote.

As a consequence, the tracking branch is named “origin/dev”.

Set tracking branches for new local branches

In order to switch to the local “dev” branch, and to set the “origin/dev” as the tracking branch (or upstream branch), use the “–track” option.

$ git checkout --track origin/dev

Branch 'dev' set up to track remote branch 'dev' from 'origin'.
Switched to a new branch 'dev'

To verify that you linked dev to the tracking branch “origin/dev” (which upstream branch is the remote dev), use the “git branch” command.

$ git branch -vv
* dev 808b598 [origin/dev] Initial commit

Set tracking branches for existing local branches

On the other hand, you may have chosen to work on a local branch and to set the upstream branch (or the remote tracking branch later on).

It is perfectly fine, but you will have to use the “git branch” in order to set the existing branch upstream branch.

$ git branch -u <remote>/<branch>

Let’s take the example of the “feature” branch that you just created to start working.

$ git checkout -b feature
Switched to a new branch 'feature'

You created some commits in your branch, you want to set the tracking branch to be master.

$ git branch -u origin/master
Branch 'feature' set up to track remote branch 'master' from 'origin'.

Great! You successfully set the upstream branch for your existing local branch.

Inspecting tracking branches configuration

In order to inspect your current Git configuration, list the hidden files and directories in your current working Git directory.

$ ls -al

total 16
drwxrwxr-x 3 schkn schkn 4096 Nov  5 16:10 .
drwxrwxr-x 7 schkn schkn 4096 Nov  5 16:10 ..
drwxrwxr-x 8 schkn schkn 4096 Nov  6 10:27 .git

Now, inspect the content of the “config” file located in the .git directory.

$ cat .git/config

[core]
        repositoryformatversion = 0
        filemode = true
        bare = false
        logallrefupdates = true
[remote "origin"]
        url = <repo_url>
        fetch = +refs/heads/*:refs/remotes/origin/*
[branch "master"]
        remote = origin
        merge = refs/heads/master

As you can see, Git keeps a reference between your local branch, the name of the remote, and the branch it has to merge with.

Conclusion

In this tutorial, you learned more about upstream branches and how they are related to remote-tracking branches in Git.

You learned different techniques in order to set remote-tracking branches using a command or an alias to set it.

You also learned how you can link your current local branches to existing remote-tracking branches easily with the branch command.

If you are interested in Software Engineering, we have a complete section dedicated to it on the website so make sure to have a look.

How To Clean Up Git Branches

How To Clean Up Git Branches | Git Clean Up Local and Remote Branches

Are you quite exhausted with the unused files in your Git Repository? Usually, we collect several distinct branches for the different features when working with Git. The possible way to resolve all these issues is to clean up your untracked git branches.

In this tutorial, we have explained many ways to clean up unused branches and make your Git workspace to be more organized. As a developer, you have to follow up these kinds of stuff up-to-date and make use of Git commands properly for your projects. This tutorial addresses the below available concepts in detail:

Git Clean

git clean is the built-in command used for cleaning up the untracked files. Be careful with this one, it deletes files permanently!

Always add -n or –dry-run options to preview the damage you’ll do!

  • Run git clean -f, to just clean untracked files.
  • Run git clean -f -d, to remove directories.
  • Run git clean -f -X, just removed an ignored files.
  • Run git clean -f -x, for cleaning ignored as well as non-ignored files.

The Git rebase merge

The four rebase commands needed to synchronize all three branches are:

cleanup@git:~$ git rebase feature develop
cleanup@git:~$ git rebase develop master
cleanup@git:~$ git rebase master feature
cleanup@git:~$ git rebase feature develop

Repeated rebase commands assist to clean up commits and flatten branch histories.

Also Check: 

Clean Up Local Git Branches

First of all, you want to check which branches have already been merged with your current branch.

In this case, we are going to imply that you want to delete local branches merged with master.

To check merged branches, use the “git branch” command with the “–merged” option.

$ git checkout master

$ git branch --merged <commit>

  feature
* master

If you omit to provide the commit hash, the command will imply that you are referring to HEAD (also known as the last commit of your current branch).

Now that you have the local branches already merged with master, you will need to delete them.

The easiest way to delete local Git branches is to use the “git branch” command with the “-d” option.

$ git branch -d <branch>

The “-d” option stands for “–delete” and it can be used whenever the branch you want to clean up is completely merged with your upstream branch.

If your branch is named “feature” for example, to clean up this branch, you would run

$ git branch -d release

Deleted branch feature (was bd6903f).

Force Delete Unmerged Git Branches

The other way of cleaning up local branches on Git is to use the “git branch” command with the “-D” option.

In this case, the “-D” option stands for “–delete -force” and it is used when your local branches are not merged yet with your remote tracking branches.

$ git branch -D <branch>

As you probably already know it, you have a local branch but you also have a remote-tracking which is a branch set to represent the state of your remote branch (also called the upstream branch).

As a consequence, if you perform a commit on your local branch without pushing it to the remote branch, your remote-tracking branch will be behind your local branch, thus unmerged.

To see differences between your local branch and your remote-tracking branch, execute the “git diff” command.

$ git diff <branch>..origin/<branch>

If there are any differences between the branches, you will have to use the “-D” option to delete the branch locally.

$ git branch -d <branch>

error: The branch 'branch' is not fully merged.
If you are sure you want to delete it, run 'git branch -D branch'.

$ git branch -D <branch>
Deleted branch feature (was 022519a).

Now that your local branches are cleaned-up, let’s see how you can delete the remote tracking branches from your Git repository.

One-line command

In some cases, it might be useful to have a one-liner in order to delete local unused branches.

For those who are curious, here is how you can delete unused local branches in one single line.

$ git branch --merged | egrep -v "(^\*|master|dev)" | xargs git branch -d

Before executing this, let’s have a quick explanation about this command :

  • git branch –merged : first, you are simply listing all the branches currently merged with your current checked out branch;
  • egrep -v “(^*|master|dev)” : you are using the invert matching feature of grep in order to exclude any branches that may be called “master” or “dev”, just in case;
  • xargs git branch -d : you are deleting every single branch listed before.

Note: You can modify the egrep command in order to include your own branches.

Clean Up Remote Tracking Branches

As a reminder, a tracking-branch is a local branch set to track changes done on the remote branch of your Git server.

Those tracking branches are created in order to track changes but they may become obsolete if remote branches were deleted on the server.

In this case, let’s say that you have a local “feature” branch, a remote-tracking branch named “origin/feature”, but the “feature” branch has been deleted on the remote.

Git Remote Prune

In order to clean up remote tracking branches, meaning deleting references to non-existing remote branches, use the “git remote prune” command and specify the remote name.

$ git remote prune <remote>

In order to find the name of your current configured remotes, run the “git remote” command with the “-v” option.

$ git remote -v

origin  https://gitserver.com/user/repository.git (fetch)

In this example, the remote name is “origin”.

In order to delete remote tracking branches, we would then execute

$ git remote prune origin

Pruning origin
URL: https://gitserver.com/user/repository.git
 * [pruned] origin/feature

Prune while fetching

In some Git workflows, branches are deleted on the remote whenever they are integrated with the master branch.

Instead of prune your remotes periodically, you can also fetch the new references and prune your branches simultaneously.

In order to clean up remote-tracking branches while fetching, use the “git fetch” command with the “–prune” option.

$ git fetch --prune <remote>

Alternatively, you can simply use the “-p” shortcut instead of typing “prune” every time.

$ git fetch -p <remote>

In the case of the origin remote, this would give

$ git fetch --prune origin

From https://gitserver.com/user/repository.git
 - [deleted]         (none)     -> origin/feature

However, specifying the prune option may be a bit tiring.

Luckily for you, you can configure your Git workspace in order to execute the prune operation every time you perform a fetch or a pull operation.

To configure Git to execute prune for every fetch, execute the following command

$ git config --global fetch.prune true

Defining your Gitflow Workflow

When working with remote-tracking and local branches, it is important for you and your team to define a Git flow that you can stick to.

If you are working with somebody in order to review changes and approve them into your codebase, it might also be necessary for the reviewer to delete the branch on the remote afterwards.

This way, you will be able to prune your unused remote-tracking branches and your local branches as seen in the first section.

Defining this step is important as it can become quite messy to deal with dozens of different branches on your local Git repository.

Now that you have a clearer idea on how to delete unused remote-tracking branches, let’s see how you can perform the same trick for remote branches.

Clean Up Remote Branches

In our last chapter, we are going to see how we can delete remote branches when they are not used anymore.

Before performing any deletion operations on your Git repository, make sure that you are up-to-date with recent commits or merges done on your repository.

$ git pull

Now that you are up-to-date, you can starting deleting your old remote branches.

To clean up old remote branches, use the “git branch” command with the “-r” and “–merged” options.

As always, you need to be on the target branch to see branches already merged with this branch.

$ git checkout master

$ git branch -r --merged <commit>

origin/feature
origin/master

Note: if you don’t specify the commit, the command will simply imply that you are referring to HEAD (also known as the last commit on the branch)

Now that you know the remote branches already merged with master, you can use the “git push” command in order to delete remote branches.

$ git push <remote> --delete <branch>

In the example given previously, this command would give

$ git push origin --delete feature

To https://gitserver.com/user/repository.git
 - [deleted]         feature

One-line command

The command provided is actually very similar to the one used in order to delete local Git branches.

To delete unused remote branches, you can use the following one-liner

$ git branch -r --merged | egrep -v "(^\*|master|dev)" | xargs -n 1 git push --delete origin

Again, let’s have a quick explanation of the different parts of this command :

  • git branch -r –merged : in this case, you are listing remote branches that are currently merged with your current checked out branch. As a consequence, make sure that you are on the correct branch, remember that the “git branch –merged” command takes the HEAD when not provided with a commit SHA;
  • egrep -v “(^*|master|dev)” : in this part, you are using the invert-matching feature of grep in order to exclude the dev and the master branches;
  • xargs -n 1 git push –delete origin : in this case, you are taking every single branch listed and deleting it on the remote.

Conclusion

From the above stuff, you will learn all the ways of cleaning up unused branches on Git, whether they are local, remote tracking branches or remote branches. If you want to check more Git related articles then keep visiting our JunosNotes.com website.