In this informative tutorial, we have covered complete details about InfluxDB like what exactly it is, why you use it, What value can developers design by fusing InfluxDB into their own environment? and many others.
Also, this guide can become an initial stage for every developer, engineer, and IT professional to understand InfluxDB concepts, use-cases, and real-world applications.
The main objective of curating this article is to make you an expert with InfluxDB in no time. So, we have designed the InfluxDB learning paths into diverse modules, each one of them bringing a new level of knowledge of time-series databases.
- How To Install InfluxDB 1.7 and 2.0 on Linux in 2021
- How To Create a Database on InfluxDB 1.7 & 2.0
- InfluxDays London 2021 Recap | Key Facts of InfluxDays London 2021
In this Definitive Guide To InfluxDB In 2021, firstly, you will gain some knowledge on the overall presentation of time-series databases, then with an in-depth explanation of the concepts that define InfluxDB, and at last, we explained the use-cases of InfluxDB and how it can be used in a variety of industries by using real-world examples.
Hence, step into the main topic and learn completely about InfluxDB Open Source Time Series Database, Key concepts, Use cases, etc. Let’s make use of the available links and directly jump into the required stuff of InfluxDB.
- What is InfluxDB?
- What are Time-Series Databases?
- Illustrated InfluxDB Concepts
- InfluxDB Use-Cases
- Your Own Imagination!
- Going Further
What is InfluxDB?
INfluxDB is definitely a fast-growing technology. The time-series database, developed by InfluxData, is seeing its popularity grow more and more over the past few months. It has become one of the references for developers and engineers willing to bring live monitoring into their own infrastructure.
Do Check: InfluxDays London Recap
What are Time-Series Databases?
Time Series Databases are database systems specially created to handle time-related data.
All your life, you have dealt with relational databases like MySQL or SQL Server. You may also have dealt with NoSQL databases like MongoDB or DynamoDB.
Those systems are based on the fact that you have tables. Those tables contain columns and rows, each one of them defining an entry in your table. Often, those tables are specifically designed for a purpose: one may be designed to store users, another one for photos, and finally for videos. Such systems are efficient, scalable, and used by plenty of giant companies having millions of requests on their servers.
Time series databases work differently. Data are still stored in ‘collections’ but those collections share a common denominator: they are aggregated over time.
Essentially, it means that for every point that you are able to store, you have a timestamp associated with it.
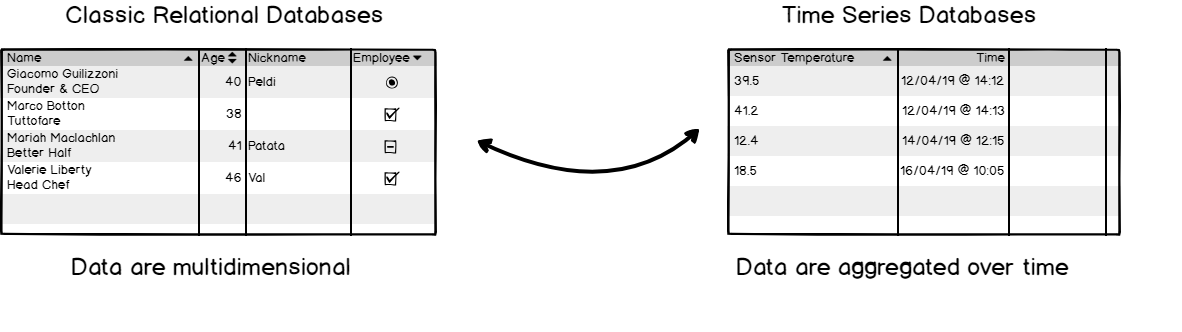
The great difference between relational databases and time-series databases
But.. couldn’t we use a relational database and simply have a column named ‘time’? Oracle for example includes a TIMESTAMP data type that we could use for that purpose.
You could, but that would be inefficient.
Why do we need time-series databases?
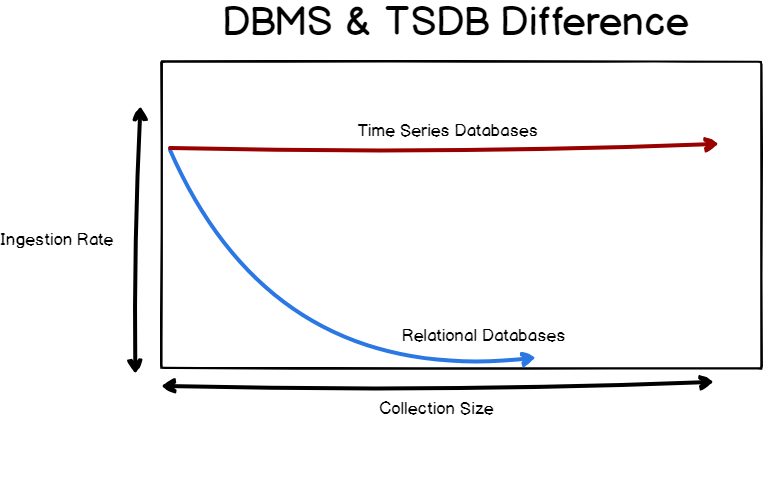
Three words: fast ingestion rate.
Time series databases systems are built around the predicate that they need to ingest data in a fast and efficient way.
Indeed, relational databases do have a fast ingestion rate for most of them, from 20k to 100k rows per second. However, the ingestion is not constant over time. Relational databases have one key aspect that makes them slow when data tend to grow: indexes.
When you add new entries to your relational database, and if your table contains indexes, your database management system will repeatedly re-index your data for it to be accessed in a fast and efficient way. As a consequence, the performance of your DBMS tends to decrease over time. The load is also increasing over time, resulting in having difficulties to read your data.
Time Series databases are optimized for a fast ingestion rate. It means that such index systems are optimized to index data that are aggregated over time: as a consequence, the ingestion rate does not decrease over time and stays quite stable, around 50k to 100k lines per second on a single node.
Specific concepts about time-series databases
On top of the fast ingestion rate, time-series databases introduce concepts that are very specific to those technologies.
One of them is data retention. In a traditional relational database, data are stored permanently until your decide to drop them yourself. Given the use-cases of time series databases, you may want not to keep your data for too long: either because it is too expensive to do so, or because you are not that interested in old data.
Systems like InfluxDB can take care of dropping data after a certain time, with a concept called retention policy (explained in detail in part two). You can also decide to run continuous queries on live data in order to perform certain operations.
You could find equivalent operations in a relational database, for example, ‘jobs’ in SQL that can run on a given schedule.
A Whole Different Ecosystem
Time Series databases are very different when it comes to the ecosystem that orbits around them. In general, relational databases are surrounded by applications: web applications, software that connects to them to retrieve information or add new entries.
Often, a database is associated with one system. Clients connect to a website, that contacts a database in order to retrieve information. TSDB is built for client plurality: you do not have a simple server accessing the database, but a bunch of different sensors (for example) inserting their data at the same time.
As a consequence, tools were designed in order to have efficient ways to produce data or to consume it.
Data consumption
Data consumption is often done via monitoring tools such as Grafana or Chronograf. Those solutions have built-in solutions to visualize data and even make custom alerts with it.
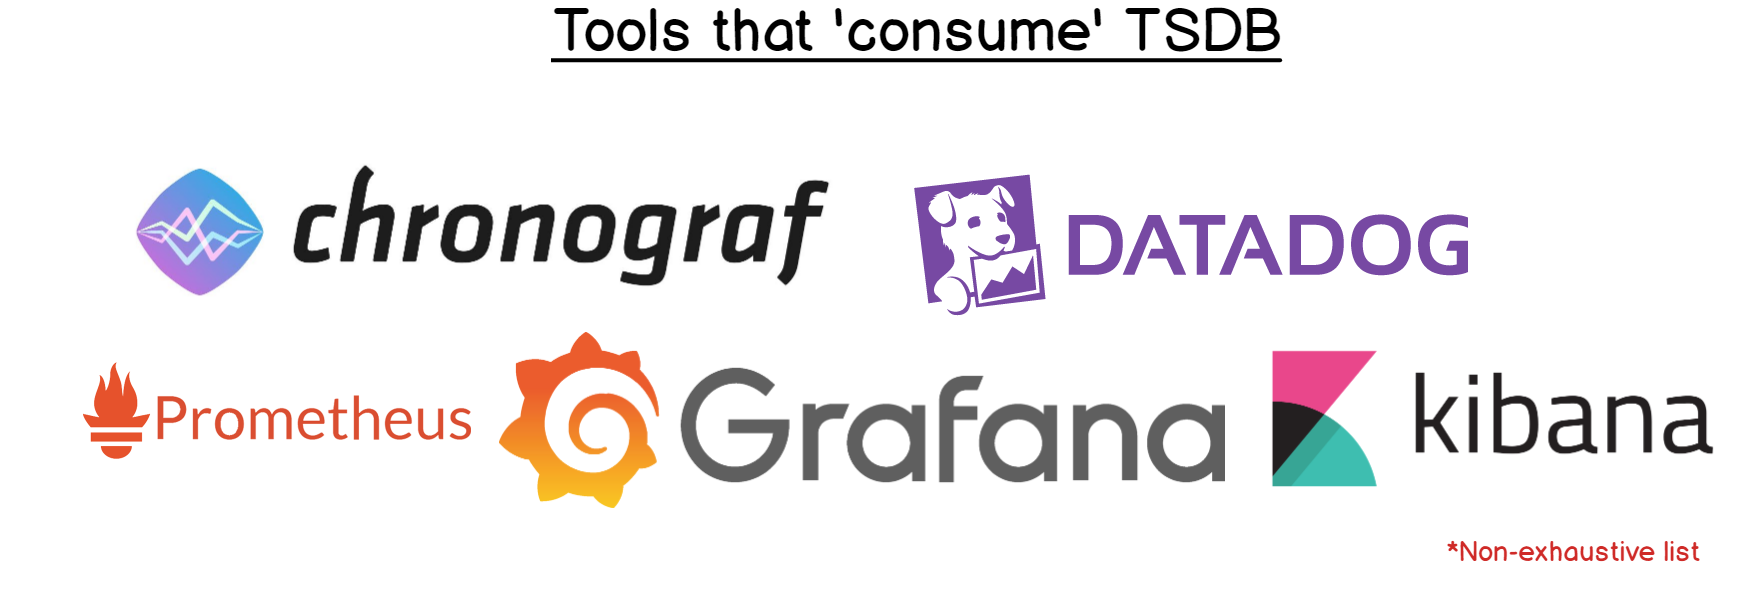
Those tools are often used to create live dashboards that may be graphs, bar charts, gauges or live world maps.
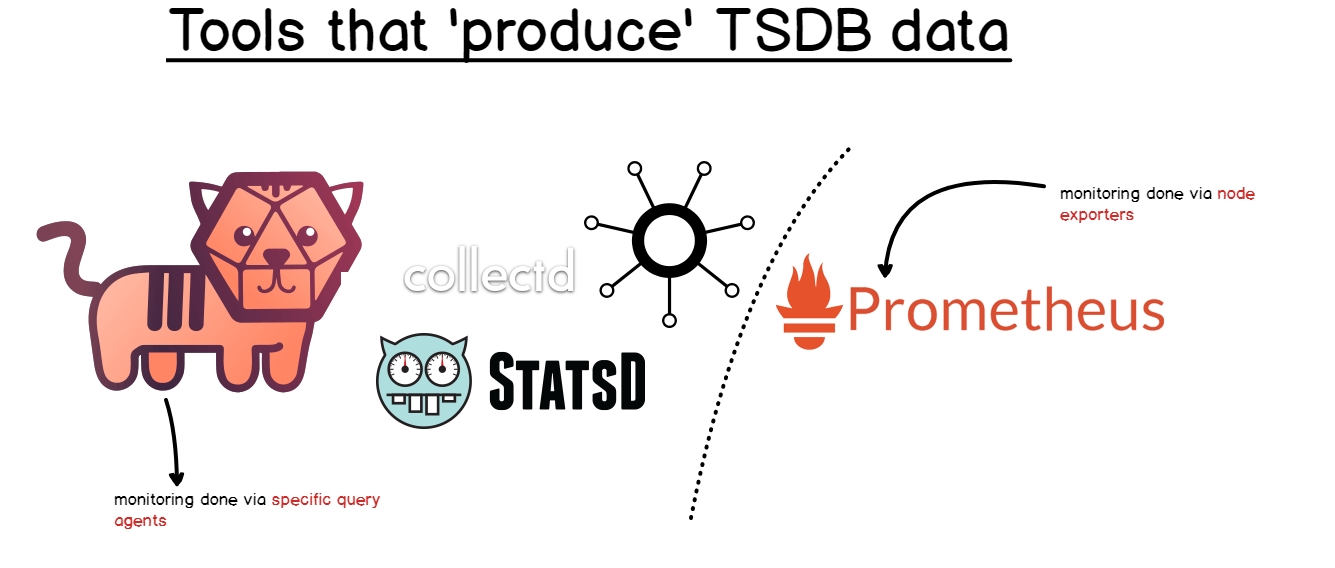
Data Production
Data production is done by agents that are responsible for targeting special elements in your infrastructure and extract metrics from them. Such agents are called “monitoring agents“. You can easily configure them to query your tools in a given time span. Examples are Telegraf (which is an official monitoring agent), CollectD or StatsD
Now that you have a better understanding of what time series databases are and how they differ from relational databases, it is time to dive into the specific concepts of InfluxDB.
Illustrated InfluxDB Concepts
In this section, we are going to explain the key concepts behind InfluxDB and the key query associated with it. InfluxDB embeds its own query language and I think that this point deserves a small explanation.
InfluxDB Query Language
Before starting, it is important for you to know which version of InfluxDB you are currently using. As of April 2019, InfluxDB comes in two versions: v1.7+ and v2.0.
v2.0 is currently in alpha version and puts the Flux language as a centric element of the platform. v1.7 is equipped with InfluxQL language (and Flux if you activate it).
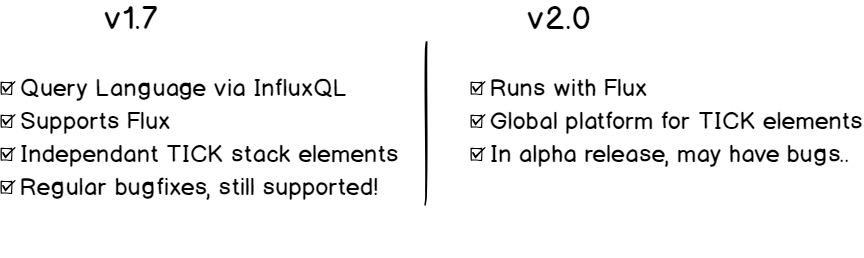
The main differences between v1.7 and v2.0
Right now, I do recommend keeping on using InfluxQL as Flux is not completely established in the platform.
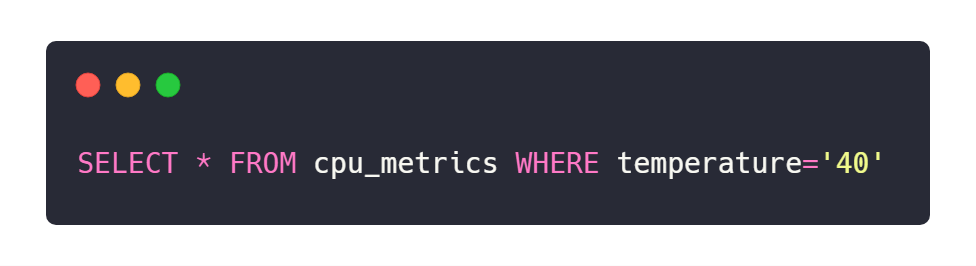
InfluxQL is a query language that is very similar to SQL and that allows any user to query its data and filter it. Here’s an example of an InfluxQL query :
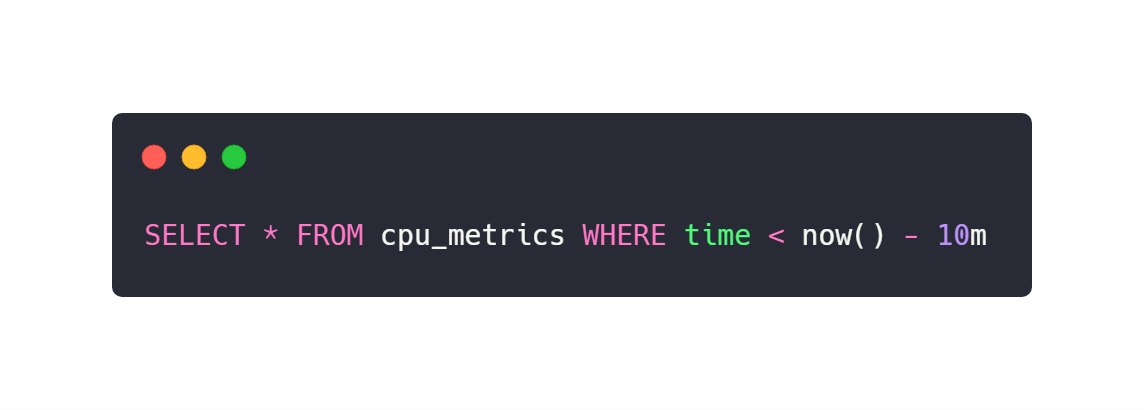
See how similar it is to the SQL language?
In the following sections, we are going to explore InfluxDB key concepts, provided with the associated IQL (short for InfluxQL) queries.
Explained InfluxDB Key Concepts

In this section, we will go through the list of essential terms to know to deal with InfluxDB in 2021.
Database
A database is a fairly simple concept to understand on its own because you are applied to use this term with relational databases. In a SQL environment, a database would host a collection of tables, and even schemas and would represent one instance on its own.
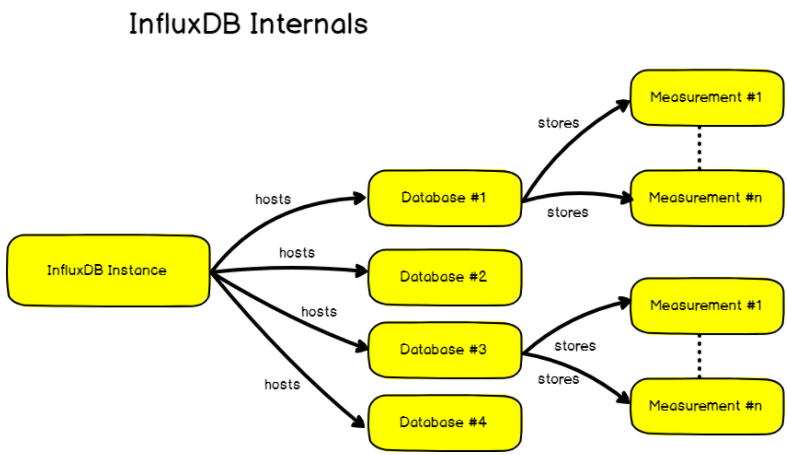
In InfluxDB, a database host a collection of measurements. However, a single InfluxDB instance can host multiple databases. This is where it differs from traditional database systems. This logic is detailed in the graph below :
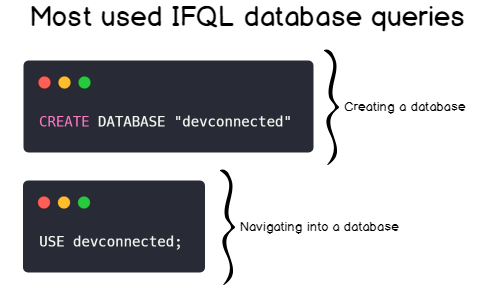
The most common ways to interact with databases are either creating a database or by navigating into a database in order to see collections (you have to be “in a database” in order to query collections, otherwise it won’t work).
Measurement
As shown in the graph above, the database stores multiple measurements. You could think of a measurement as a SQL table. It stores data, and even metadata, over time. Data that are meant to coexist together should be stored in the same measurement.
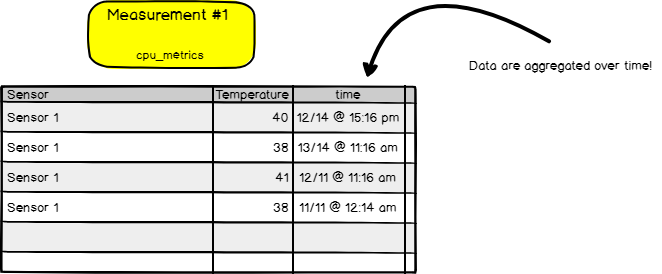
Measurement Example
Measurement IFQL example
In a SQL world, data are stored in columns, but in InfluxDB we have two other terms: tags & fields.
Tags & Fields
Warning! This is a very important chapter as it explains the subtle difference between tags & fields.
When I first started with InfluxDB, I had a hard time grasping exactly why are tags & fields different. For me, they represented ‘columns’ where you could store exactly the same data.
When defining a new ‘column’ in InfluxDB, you have the choice to either declare it as a tag or as a value and it makes a very big difference.
In fact, the biggest difference between the two is that tags are indexed and values are not. Tags can be seen as metadata defining our data in the measurement. They are hints giving additional information about data, but not data itself.
Fields, on the other side, is literally data. In our last example, the temperature ‘column’ would be a field.
Back to our cpu_metrics example, let’s say that we wanted to add a column named ‘location’ as its name states, defines where the sensor is.
Should we add it as a tag or a field?
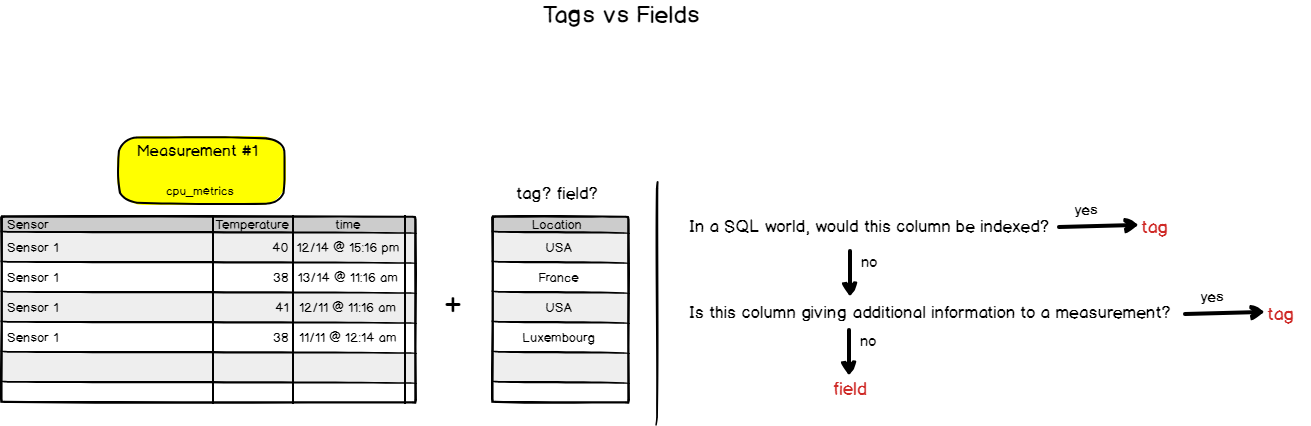
In our case, it would be added as a.. tag! We definitely want the location ‘column’ to be indexed and taken into account when performing a query over the location.
In general, I would advise keeping your measurements relatively small when it comes to the number of fields. More and more fields often rhyme with lower performance. You could create other measurements to store another field and index it properly.
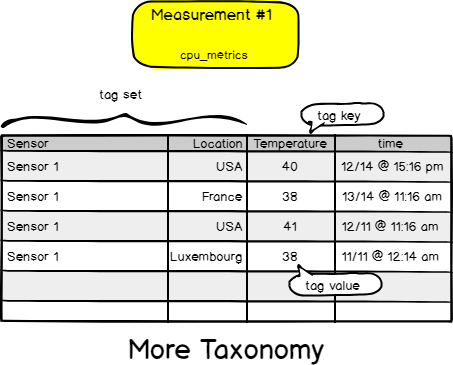
Now that we’ve added the location tag to our measurement, let’s go a bit deeper into the taxonomy.
A set of tags is called a “tag-set”. The ‘column name’ of a tag is called a “tag key”. Values of a tag are called “tag values”. The same taxonomy repeats for fields. Back to our drawings.
Timestamp
Probably the simplest keyword to define. A timestamp in InfluxDB is a date and a time defined in RFC3339 format. When using InfluxDB, it is very common to define your time column as a timestamp in Unix time expressed in nanoseconds.
Tip: you can choose a nanosecond format for the time column and reduce the precision later by adding trailing zeros to your time value for it to fit the nanosecond format.
Retention policy
This feature of InfluxDB is for me one of the best features there is.
A retention policy defines how long you are going to keep your data. Retention policies are defined per database and of course, you can have multiple of them. By default, the retention policy is ‘autogen‘ and will basically keep your data forever. In general, databases have multiple retention policies that are used for different purposes.
What are the typical use-cases of retention policies?
Let’s pretend that you are using InfluxDB for live monitoring of an entire infrastructure.
You want to be able to detect when a server goes off for example. In this case, you are interested in data coming from that server in the present or short moments before. You are not interested in keeping the data for several months, as a result, you want to define a small retention policy: one or two hours for example.
Now if you are using InfluxDB for IoT, capturing data coming from a water tank for example. Later, you want to be able to share your data with the data science team for them to analyze it. In this case, you might want to keep data for a longer time: five years for example.
Point
Finally, an easy one to end this chapter about InfluxDB terms. A point is simply a set of fields that has the same timestamp. In a SQL world, it would be seen as a row or as a unique entry in a table. Nothing special here.
Congratulations on making it so far! In the next chapter, we are going to see the different use-cases of InfluxDB and how it can be used to take your company to the next level.
InfluxDB Use-Cases
Here is a detailed explanation of InfluxDB Use-Cases:
DevOps Monitoring
DevOps Monitoring is a very big subject nowadays. More and more teams are investing in building fast and reliable architectures that revolve around monitoring. From services to clusters of servers, it is very common for engineers to build a monitoring stack that provides smart alerts.
If you are interested in learning more about DevOps Monitoring, I wrote a couple of guides on the subject, you might find them relevant to your needs.
From the tools defined in section 1, you could build your own monitoring infrastructure and bring direct value to your company or start-up.
IoT World
The IoT is probably the next big revolution that is coming in the next few years. By 2020, it is estimated that over 30 billion devices will be considered IoT devices. Whether you are monitoring a single device or a giant network of IoT devices, you want to have accurate and instant metrics for you to take the best decisions regarding the goal you are trying to achieve.
Real companies are already working with InfluxDB for IoT. One example would be WorldSensing, a company that aims at expanding smart cities via individual concepts such as smart parking or traffic monitoring system. Their website is available here :
Industrial & Smart Plants
Plants are becoming more and more connected. Tasks are more automated than ever : as a consequence it brings an obvious need to be able to monitor every piece of the production chain to ensure a maximal throughput. But even when machines are not doing all the work and humans are involved, time-series monitoring is a unique opportunity to bring relevant metrics to managers.
Besides reinforcing productivity, they can contribute to building safer workplaces as they are able to detect issues quicker. Value for managers as well as for workers.
Your Own Imagination!
The examples detailed above are just examples and your imagination is the only limit to the applications that you can find for Time Series databases. I have shown it via some articles that I wrote, but time-series can be even used in cybersecurity!
If you have cool applications of InfluxDB or time-series database, post them as comments below, it is interesting to see what idea people can come up with.
Going Further
In this article, you learned many different concepts: what are time-series databases and how they are used in the real world. We have gone through a complete list of all the technical terms behind InfluxDB, and I am confident now to say that you are to go on your own adventure.
My advice to you right now would be to build something on your own. Install it, play with it, and start bringing value to your company or start-up today. Create a dashboard, play with queries, setup some alerts: there are many things that you will have to do in order to complete your InfluxDB journey.
If you need some inspiration to go further, you can check the other articles that we wrote on the subject: they provide clear step-by-step guides on how to setup everything.