
Guys who are working as a DevOps engineer or a Site Reliability Engineer should aware of various techniques to monitor their Windows servers. If you are familiar with such tasks then you can easily solve your windows server down issues.
You may get some random doubts whenever your serves go down like Is it due to the high CPU usage on one of the processes? Is the RAM used too much on my Windows server? or Is the server having some memory issues?
To clarify all these queries today we have come up with a new interesting tutorial ie., Windows Server Monitoring using Prometheus and WMI Exporter.
If you are not having an overview of Prometheus Monitoring, check out this Definitive Guide by clicking on the link and start learning about the monitoring of windows servers with Prometheus and WMI Exporter.
Are you ready to monitor your Windows Servers? If yes, then go through these direct links for quick access to the main concept of this tutorial.
- Windows Server Monitoring Architecture
- Installing Prometheus
- Installing the WMI Exporter
- Building an Awesome Grafana Dashboard
- Raising alerts in Grafana on high CPU usage
What is WMI Exporter?
WMI Exporter is an exporter utilized for windows servers to collects metrics like CPU usage, memory, and Disk usage.
It is open-source which can be installed on Windows servers using the .msi installer
Prerequisites
If you want to follow this tutorial, then you require the following stuff:
- One Linux server set up
- Prometheus 2.x installed on your server, including the Prometheus Web UI.
- Check out your Prometheus version by running the Prometheus
-versioncommand. The output comprises your Prometheus version as well as build information.
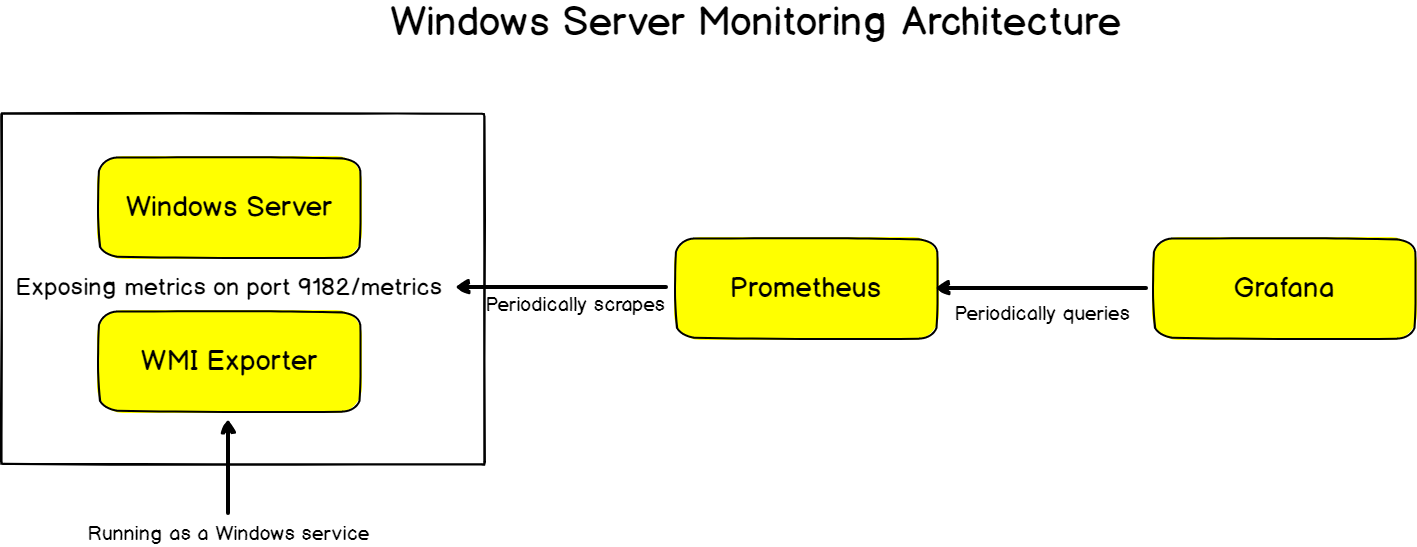
Windows Server Monitoring Architecture
Before installing the WMI exporter, let’s have a quick look at what our final architecture looks like.
As a reminder, Prometheus is constantly scraping targets.
Targets are nodes that are exposing metrics on a given URL, accessible by Prometheus.
Such targets are equipped with “exporters”: exporters are binaries running on a target and responsible for getting and aggregating metrics about the host itself.
If you were to monitor a Linux system, you would run a “Node Exporter“, which would be responsible for gathering metrics about the CPU usage or the disk I/O currently in use.
- MongoDB Monitoring with Grafana & Prometheus | Mongodb Prometheus Grafana Dashboard
- How To Install Prometheus with Docker on Ubuntu 18.04
- Complete Node Exporter Mastery with Prometheus | Monitoring Linux Host Metrics WITH THE NODE EXPORTER
For Windows hosts, you are going to use the WMI exporter.
The WMI exporter will run as a Windows service and it will be responsible for gathering metrics about your system.
In short, here is the final architecture that you are going to build.
Installing Prometheus
The complete Prometheus installation for Linux was already covered in one of our previous articles. Check out our Prometheus tutorials main page or else click on this direct link How To Install Prometheus with Docker on Ubuntu 18.04
Ensure to read it extensively to have your Prometheus instance up and running.
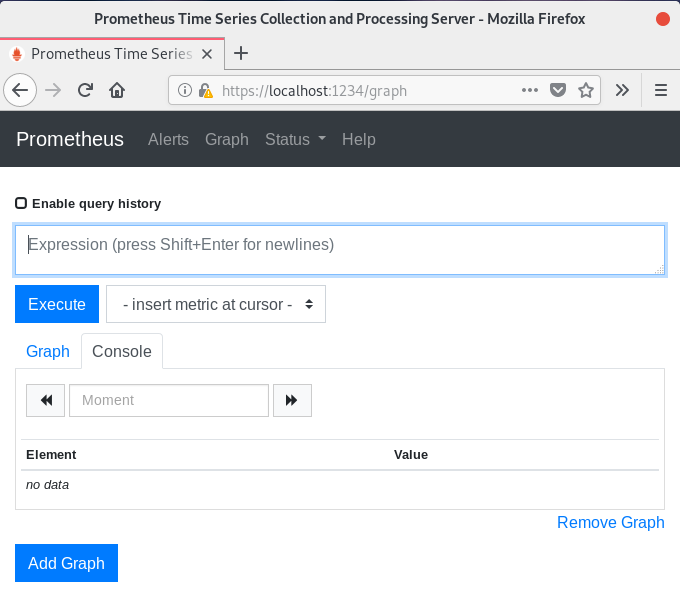
To verify it, head over to http://localhost:9090 (9090 being the default Prometheus port).
You should see a Web Interface similar to this one.
If this is the case, it means that your Prometheus installation was successful.
Great!
Now that your Prometheus is running, let’s install the WMI exporter on your Windows Server.
Installing the WMI Exporter
The WMI exporter is an awesome exporter for Windows Servers.
It will export metrics such as CPU usage, memory, and disk I/O usage.
The WMI exporter can also be used to monitor IIS sites and applications, the network interfaces, the services, and even the local temperature!
If you want a complete look at everything that the WMI exporter offers, have a look at all the collectors available.
In order to install the WMI exporter, head over to the WMI releases page on GitHub.
a – Downloading the WMI Exporter MSI
As of August 2019, the latest version of the WMI exporter is 0.8.1.
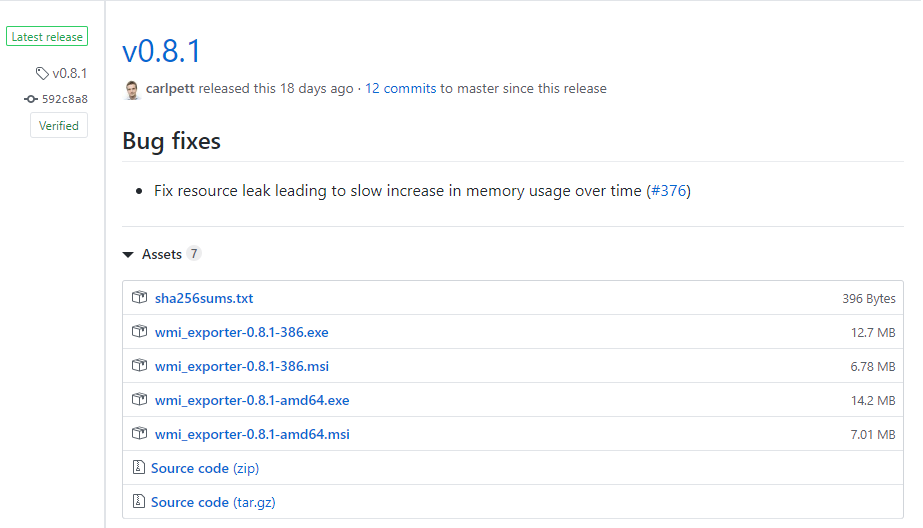
On the releases page, download the MSI file corresponding to your CPU architecture.
In my case, I am going to download the wmi_exporter-0.8.1-amd64.msi file.
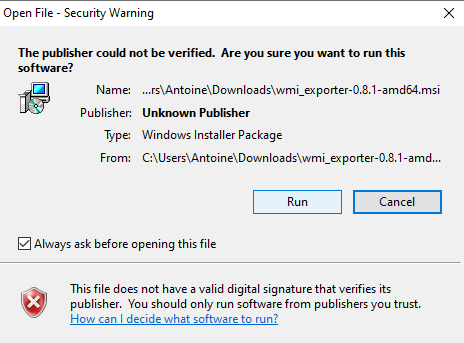
b – Running the WMI installer
When the download is done, simply click on the MSI file and start running the installer.
This is what you should see on your screen.
Windows should now start configuring your WMI exporter.
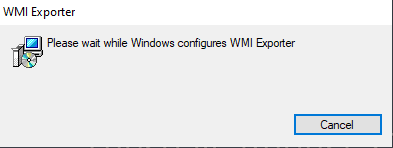
You should be prompted with a firewall exception. Make sure to accept it for the WMI exporter to run properly.
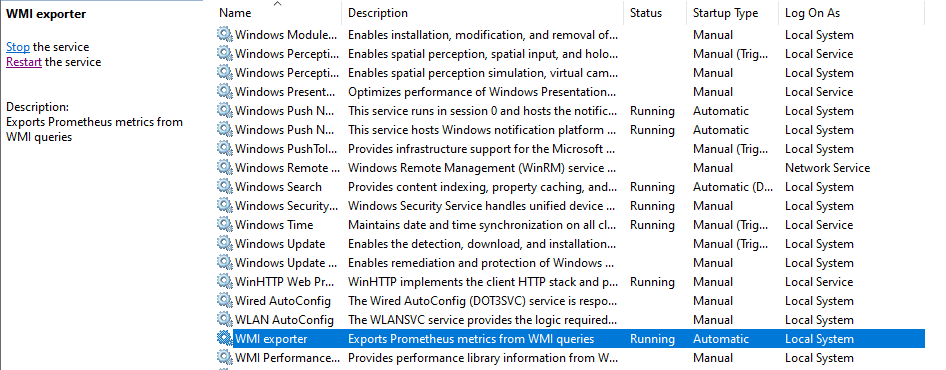
The MSI installation should exit without any confirmation box. However, the WMI exporter should now run as a Windows service on your host.
To verify it, head over to the Services panel of Windows (by typing Services in the Windows search menu).
In the Services panel, search for the “WMI exporter” entry in the list. Make sure that your service is running properly.
c – Observing Windows Server metrics
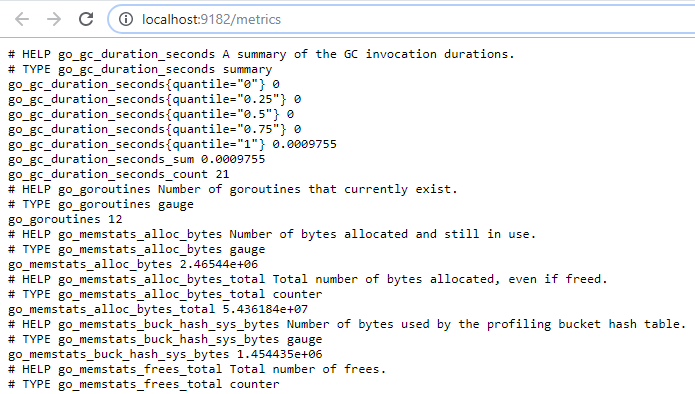
Now that your exporter is running, it should start exposing metrics on
Open your web browser and navigate to the WMI exporter URL. This is what you should see in your web browser.
Some metrics are very general and exported by all the exporters, but some of the metrics are very specific to your Windows host (like the wmi_cpu_core_frequency_mhz metric for example)
Great!
Now, Windows Server monitoring is active using the WMI exporter.
If you remember correctly, Prometheus scrapes targets.
As a consequence, we have to configure our Windows Server as a Prometheus target.
This is done in the Prometheus configuration file.
d – Binding Prometheus to the WMI exporter
As you probably saw from your web browser request, the WMI exporter exports a lot of metrics.
As a consequence, there is a chance that the scrape request times out when trying to get the metrics.
This is why we are going to set a high scrape timeout in our configuration file.
If you want to keep a low scrape timeout, make sure to configure the WMI exporter to export fewer metrics (by specifying just a few collectors for example).
Head over to your configuration file (mine is located at /etc/prometheus/prometheus.yml) and edit the following changes to your file.
scrape_configs:
# The job name is added as a label `job=<job_name>` to any timeseries scraped from this config.
  - job_name: 'prometheus'

    # Careful, the scrape timeout has to be lower than the scrape interval.
    scrape_interval: 6s
    scrape_timeout: 5s
    static_configs:
            - targets: ['localhost:9090', 'localhost:9216']
Save your file, and restart your Prometheus service.
$ sudo systemctl restart prometheus
$ sudo systemctl status prometheus
Head back to the Prometheus UI, and select the “Targets” tab to make sure that Prometheus is correctly connected to the WMI exporter.
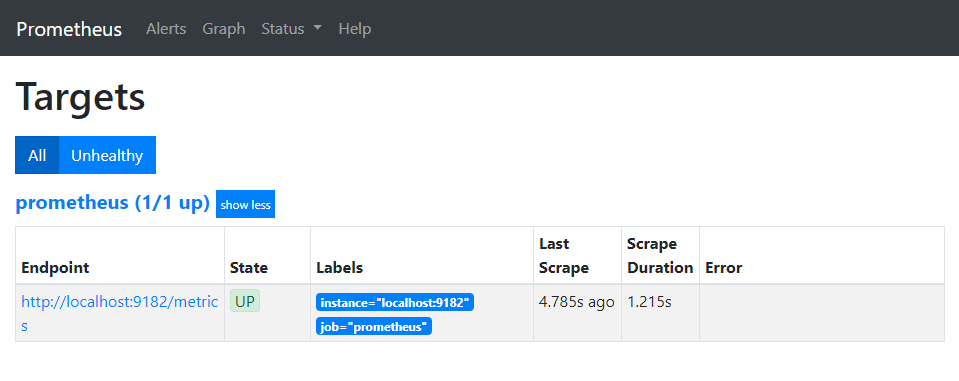
If you are getting the following error, “context deadline exceeded”, make sure that the scrape timeout is set in your configuration file.
Great! Our Windows Server monitoring is almost ready.
Now it is time for us to start building an awesome Grafana dashboard to monitor our Windows Server.
Building an Awesome Grafana Dashboard
Complete MySQL dashboard with Grafana & Prometheus and MongoDB Monitoring with Grafana & Prometheus are some of our previous guides on Prometheus & Grafana installation. Make sure to configure your Grafana properly before moving to the next section.
If you are looking to install Grafana on Windows, here is another guide for it.
Prometheus should be configured as a Grafana target and accessible through your reverse proxy.
a – Importing a Grafana dashboard
In Grafana, you can either create your own dashboards or you can use pre-existing ones that contributors already crafted for you.
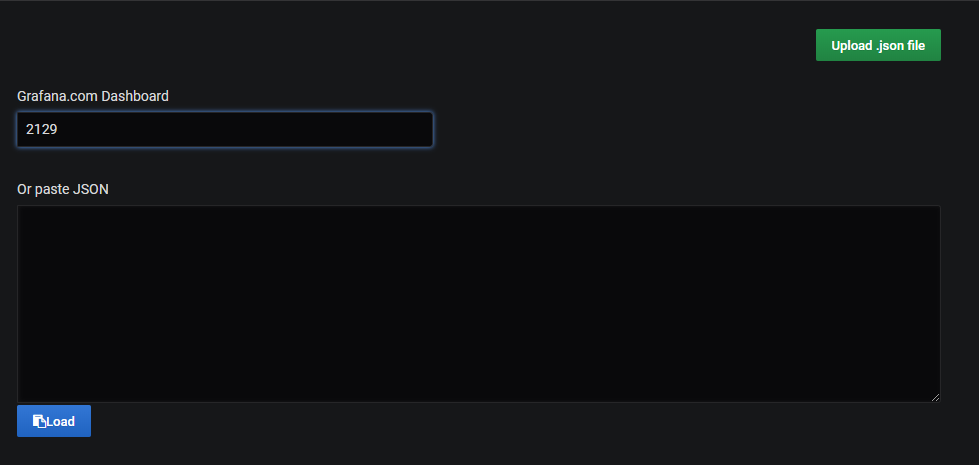
In our case, we are going to use the Windows Node dashboard, accessible via the 2129 ID.
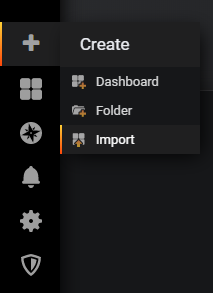
Head over to the main page of Grafana (located at http://localhost:3000 by default), and click on the Import option in the left menu.
In the next window, simply insert the dashboard ID in the corresponding text field.
From there, Grafana should automatically detect your dashboard as the Windows Node dashboard. This is what you should see.
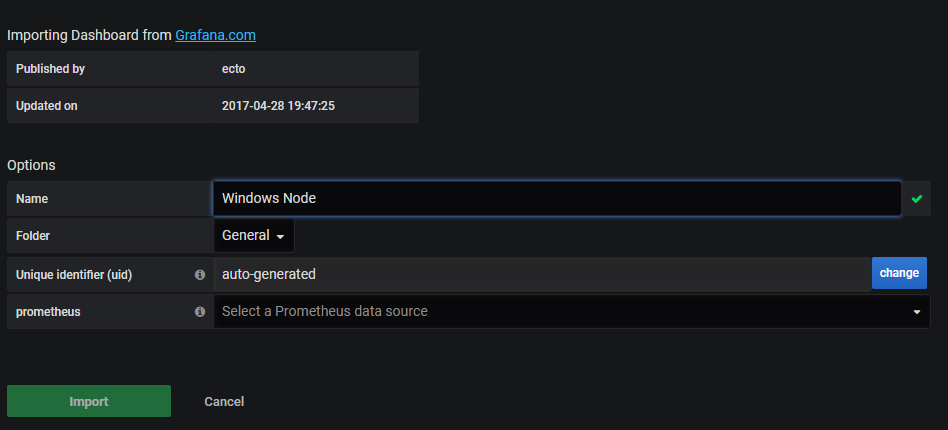
Select your Prometheus datasource in the “Prometheus” dropdown, and click on “Import” for the dashboard to be imported.
Awesome!
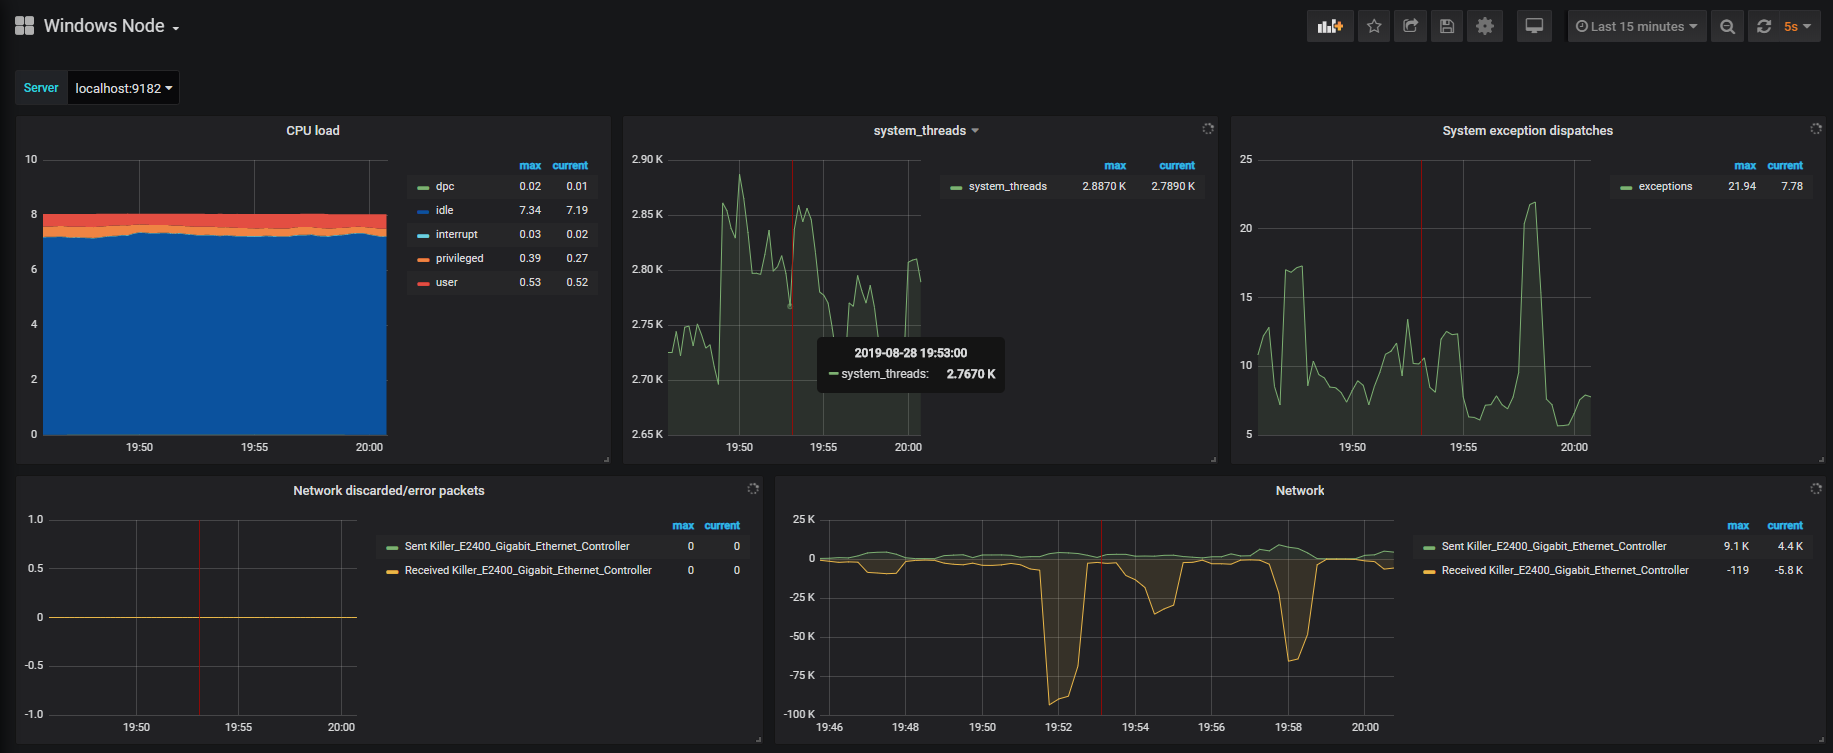
An entire dashboard displaying Windows metrics was created for us in just one click.
As you can see, the dashboard is pretty exhaustive.
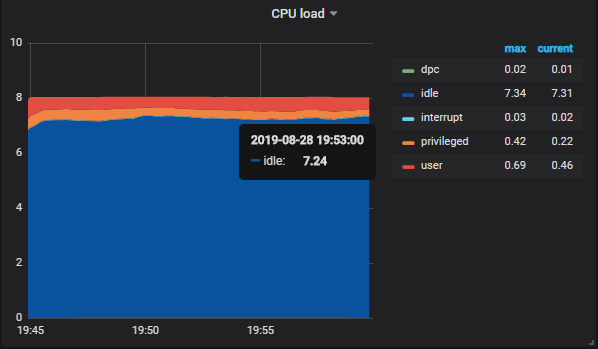
You can monitor the current CPU load, but also the number of threads created by the system, and even the number of system exceptions dispatched.
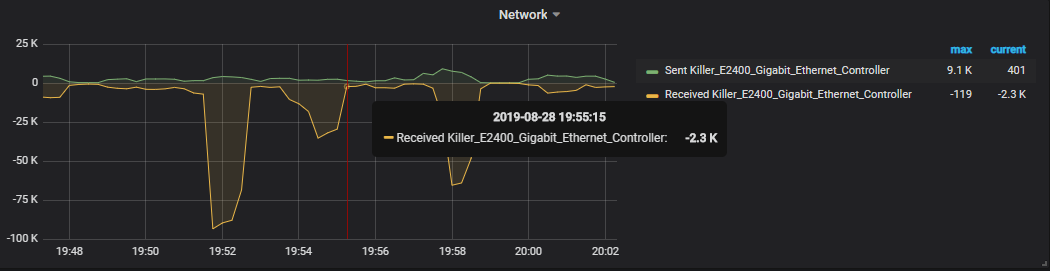
On the second line, you have access to metrics related to network monitoring. You can for example have a look at the number of packets sent versus the number of packets received by your network card.
It can be useful to track anomalies on your network, in case of TCP flood attacks on your servers for example.
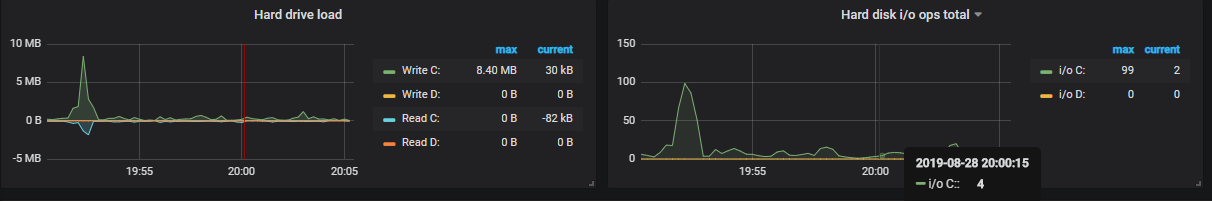
On the third line, you have metrics related to the disk I/O usage on your computer.
Those metrics can be very useful when you are trying to debug applications (for example ASP.NET applications). Using those metrics, you can see if your application consumes too much memory or too much disk.
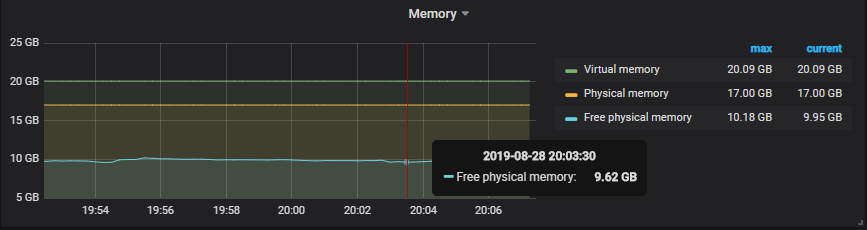
Finally, one of the greatest panels has to be memory monitoring. RAM has a very big influence on the overall system performance.
Consequently, it has to be monitored properly, and this is exactly what the fourth line of the dashboard does.
That’s an awesome dashboard, but what if we want to be alerted whenever the CPU usage is too high for example?
Wouldn’t it be useful for our DevOps teams to know about it in order to see what’s causing the outage on the machine?
This is what we are going to do in the next section.
Raising alerts in Grafana on high CPU usage
As discussed in the previous section, you want alerts to be raised when the CPU usage is too high.
Grafana is equipped with an alerting system, meaning that whenever a panel raises an alert it will propagate the alert to “notification channels“.
Notification channels are Slack, your internal mailing system of PagerDuty for example.
In this case, we are going to use Slack as it is a pretty common team productivity tool used in companies.
a – Creating a Slack webhook
For those who are not familiar with Slack, you can create webhooks that essentially address for external sources to reach Slack.
As a consequence, Grafana will post the alert to the Webhook address, and it will be displayed in your Slack channel.
To create a Slack webhook, head over to your Slack apps page.
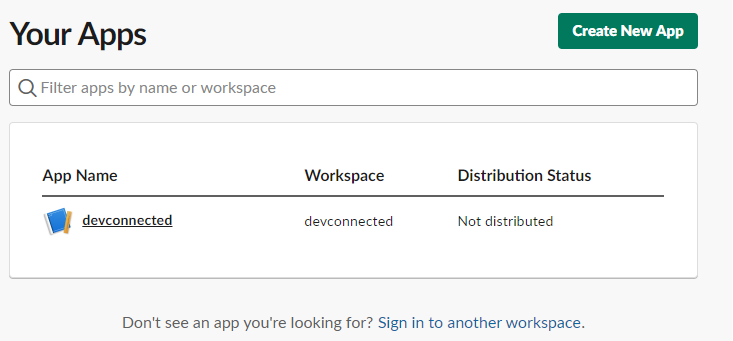
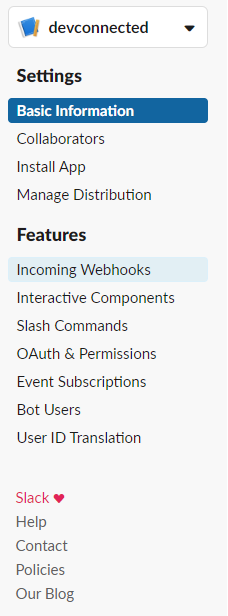
Click on the name of your app (“devconnected” here). On the left menu, click on “Incoming Webhooks”.
On the next page, simply click on “Add New Webhook to Workspace“.
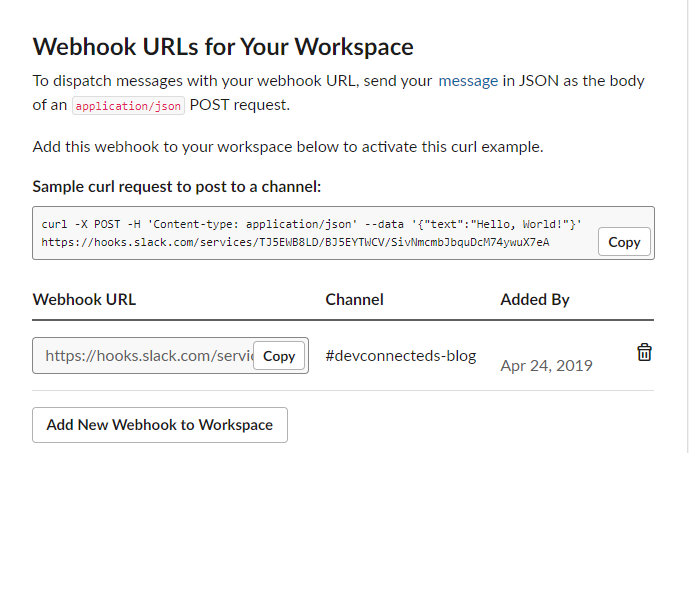
On the next screen, choose where you want your alert messages to be sent. In this case, I will choose the main channel of my Slack account.

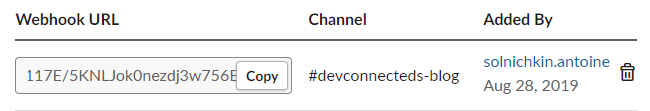
Click on “Allow”. From there, your Slack Webhook URL should be created.
b – Set Slack as a Grafana notification channel
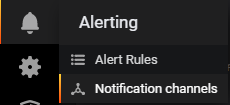
Copy the Webhook URL and head over to the Notifications Channels window of Grafana. This option is located in the left menu.
Click on the option, and you should be redirected to the following window.
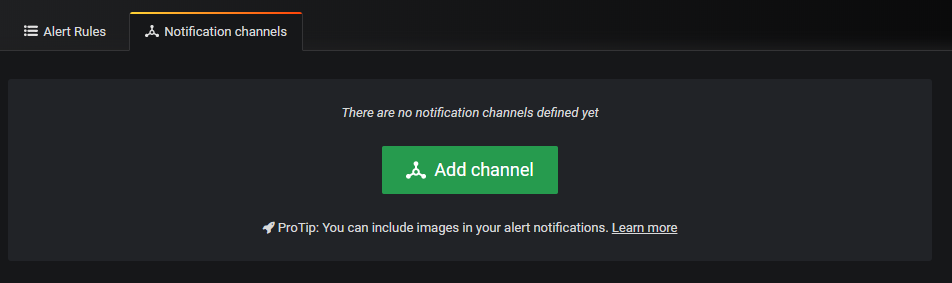
Click on “Add channel”. You should be redirected to the notification channel configuration page.
Copy the following configuration, and change the webhook URL with the one you were provided with in the last step.
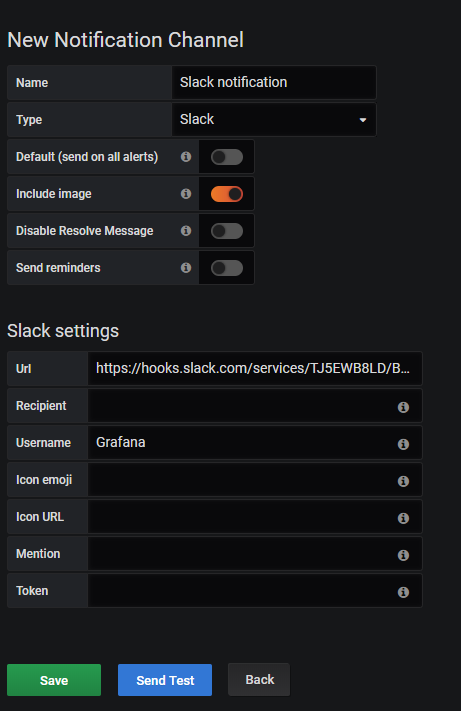
When your configuration is done, simply click on “Send Test” to send a test notification to your Slack channel.
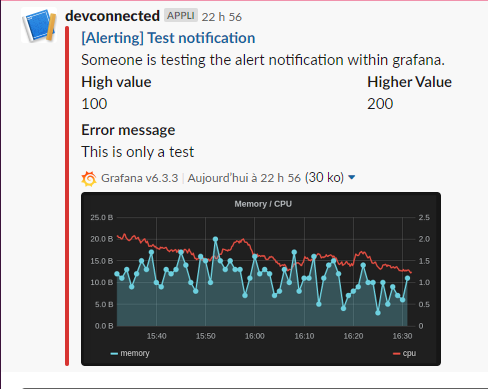
Great! Your notification channel is working properly.
Let’s create a PromQL query to monitor our CPU usage.
c – Building a PromQL query
If you are not familiar with PromQL, there is a section dedicated to this language in my Prometheus monitoring tutorial.
When taking a look at our CPU usage panel, this is the PromQL query used to display the CPU graph.
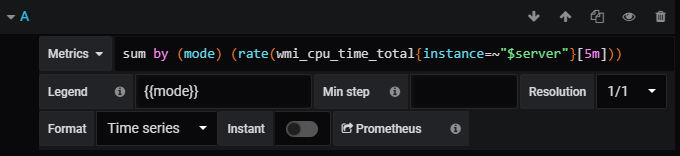
First, the query splits the results by the mode (idle, user, interrupt, DPC, privileged). Then, the query computes the average CPU usage for a five minutes period, for every single mode.
In the end, the modes are displayed with aggregated sums.
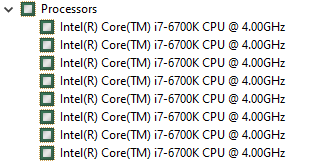
In my case, my CPU has 8 cores, so the overall usage sums up to 8 in the graph.
If I want to be notified when my CPU usage peaks at 50%, you essentially want to trigger an alert when the idle state goes below 4 (as 4 cores are going to be fully used).
To monitor our CPU usage, we are going to use this query
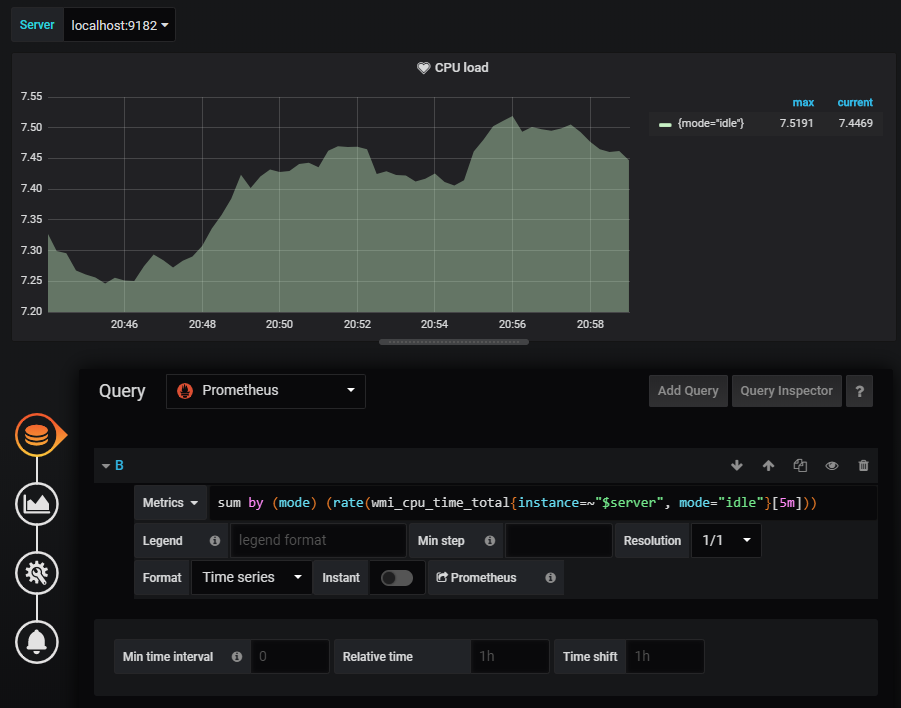
sum by (mode) (rate(wmi_cpu_time_total{instance=~"localhost:9182", mode="idle"}[5m]))
I am not using a template variable here for the instance as they are not supported by Grafana for the moment.
This query is very similar to the one already implemented in the panel, but it specifies that we specifically want to target the “idle” mode of our CPU.
Replace the existing query with the query we just wrote.
This is what you should now have in your dashboard.
Now that your query is all set, let’s build an alert for it.
d – Creating a Grafana alert
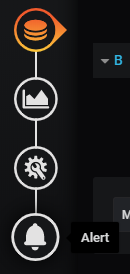
In order to create a Grafana alert, click on the bell icon located right under the query panel.
In the rule panel, you are going to configure the following alert.
Every 10 seconds, Grafana will check if the average CPU usage for the last 10 seconds was below 4 (i.e using more than 50% of our CPU).
If it is the case, an alert will be sent to Slack, otherwise, nothing happens.
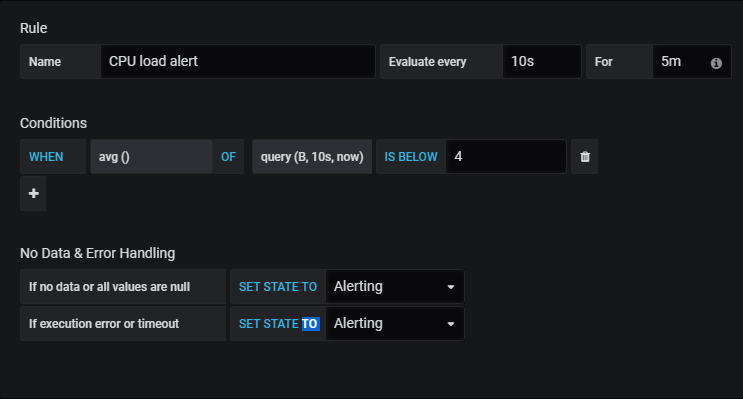
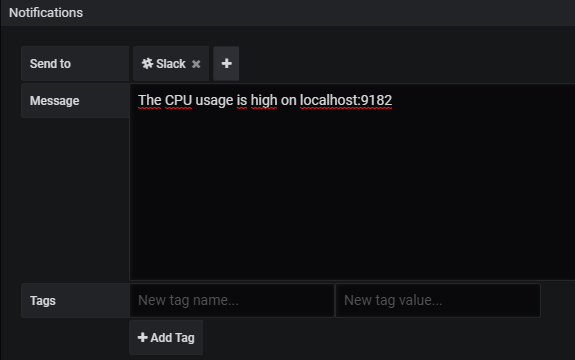
Finally, right below this rule panel, you are going to configure the Slack notification channel.
Now let’s try to bump the CPU usage on our instance.
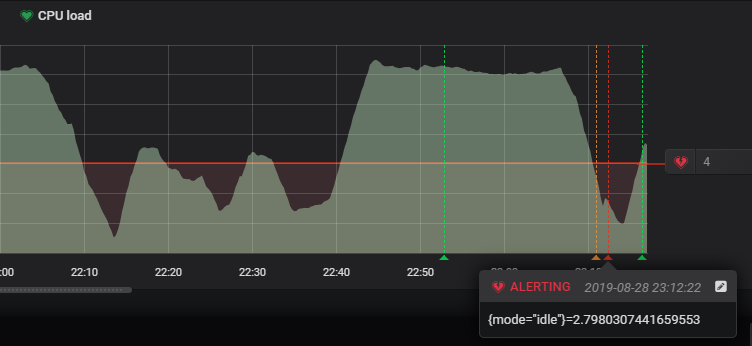
As the CPU usage goes below the 4 thresholds, it should set the panel state to “Alerting” (or “Pending” if you specified a “For” option that is too long).
From there, you should receive an alert in Slack.
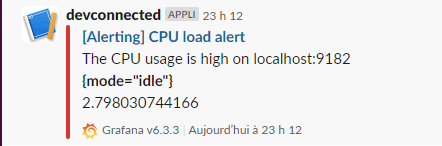
As you can see, there is even an indication of the CPU usage (73% in this case).
Great! Now our DevOps is aware that there is an issue on this server and they can investigate what’s happening exactly.
Conclusion
As you can see, monitoring Windows servers can easily be done using Prometheus and Grafana.
With this tutorial, you had a quick overview of what’s possible with the WMI exporter. So what’s next?
From there, you can create your own visualizations, your own dashboards, and your own alerts.
Our monitoring section contains a lot of examples of what’s possible and you can definitely take some inspiration from some of the dashboards.
Until then, have fun, as always.