
Whenever you are working with Prometheus, you must be familiar with How To Install and Configure Blackbox Exporter for Prometheus as it helps to monitor the endpoints with ease.
In case you are working as a network engineer then you should resolve DNS response times to diagnose network latency issues. In order to fix the problems, you need to have comprehensive monitoring of your ICMP requests to collect more data regarding network health.
Today’s tutorial is completely about the installation and configuration of the Blackbox exporter with Prometheus also you can take a look at the basic information like what is a Blackbox exporter? Monitoring with blackbox exporter, etc.
Let’s be ready with prerequisites and start installing & configuring the Blackbox Exporter with Prometheus?
- What You Are Going To Learn?
- Installing Prometheus Securely
- What is the Blackbox exporter with Prometheus?
- Installing the Blackbox exporter for Prometheus
- Monitoring HTTPS endpoints with the Blackbox Exporter
- Visualizing HTTP metrics on Grafana
What You Are Going To Learn?
By following this tutorial until the end, here are the concepts that you are going to learn about.
- How to install Prometheus securely using authentication and TLS encryption;
- What is the Blackbox exporter and how it differs from application instrumenting;
- How to install the Blackbox exporter as a service;
- How to bind the Blackbox exporter with Prometheus;
- How to monitor your first HTTP endpoint.
That’s quite a long program, let’s head to it.
Also Check: Windows Server Monitoring using Prometheus and WMI Exporter
Installing Prometheus Securely
Firstly, have a look at our previous tutorial ie., how to install Prometheus on Linux operating systems, and then start following this guide carefully, your Prometheus server is currently sitting behind a reverse proxy with authentication enabled.
In this tutorial, we are going to use the https://localhost:1234 URL in order to reach Prometheus with the Blackbox exporter.
However, if you configured Prometheus on another URL, you will need to change the configuration options provided in this tutorial.
What is the Blackbox exporter with Prometheus?
The Blackbox exporter is a probing exporter or a tool that allows engineers to monitor such as HTTP, HTTPS, DNS, ICMP, or TCP endpoints.
By using the BlackBox exporter, we are able to scrape the details of all the endpoints on the target examples with details like response time, Status code, SSL certificate expiry, and DNS lookup latencies.
- How To Install Prometheus with Docker on Ubuntu 18.04
- Complete Node Exporter Mastery with Prometheus | Monitoring Linux Host Metrics WITH THE NODE EXPORTER
- MongoDB Monitoring with Grafana & Prometheus | Mongodb Prometheus Grafana Dashboard
a – Blackbox general concepts
The Blackbox exporter provides metrics about HTTP latencies, DNS lookups latencies as well as statistics about SSL certificates expiration.
The Blackbox exporter is mainly used to measure response times.
As a consequence, if you are looking for more detailed metrics for your application (for example a Python application), you will have to instrument your application.
It is noteworthy to say that the Blackbox exporter can be bound with the AlertManager and Prometheus in order to have detailed alerts when one endpoint goes down.
When running, the Blackbox exporter is going to expose an HTTP endpoint that can be used in order to monitor targets over the network. By default, the Blackbox exporter exposes the /probe endpoint that is used to retrieve those metrics.
For example, if my Blackbox exporter is running on port 9115, and if I query metrics for google.com, this is the endpoint that I can query from the exporter.
$ http://localhost:9115/probe?target=https://google.com&module=https_2xx
As you probably understand, the Blackbox exporter is a standalone tool, it does not need any other tools to run.
On the other hand, Prometheus binds to the exporter. You are going to define ‘targets’ in a dedicated Blackbox configuration section, and Prometheus will issue requests to the probe endpoint we saw earlier.
Prometheus is acting as a way to automate requests and as a way to store them for long-term storage.
b – What are the Blackbox modules?
As with most of the Prometheus ecosystem tools, the BlackBox exporter is configured with a YAML configuration file.
The Blackbox exporter configuration file is made of modules.
A module can be seen as one probing configuration for the Blackbox exporter.
As a consequence, if you choose to have an HTTP prober checking for successful HTTPS responses (2xx HTTP codes for example), the configuration will be summarized within the same module.
The documentation for modules is available here. As you can see, you have many options for all the probers that are available to you.
Monitoring endpoint’s availability is either a success or a failure.
As a consequence, the Blackbox exporter will report if it successfully probed the targets it was assigned (0 for a failure and 1 for success).
Given the value of the probing, you can choose to define alerts in order to be notified (on Slack for example) when an endpoint goes down.
c – How does the Blackbox exporter differ from application instrumenting?
As a reminder, application instrumenting means that you are adding client libraries to an application in order to expose metrics to Prometheus.
Client libraries are available for most programming languages and frameworks such as Go, Python, Java, Javascript, or Ruby.
The main difference between the Blackbox exporter and application instrumenting is that the Blackbox exporter only focuses on availability while instrumentations can go more into details about the performance.
With instrumentation, you can choose to monitor the performance of a single SQL query for example, or a single server function.
The Blackbox exporter will not be able to expose this granularity, only a request failure or a request success.
Now that you have some concepts about the Blackbox exporter, let’s start installing it as a service on our host.
Installing the Blackbox exporter for Prometheus
First of all, you are going to download the latest version of the Blackbox exporter available for Prometheus.
a – Downloading the Blackbox exporter
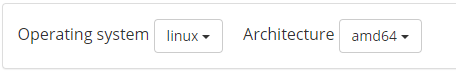
To download the Blackbox exporter, head over to the Prometheus downloads page.
Filter your results by choosing Linux as the current operating system.
Scroll down a bit, and find the blackbox exporter executable, right below the AlertManager section.
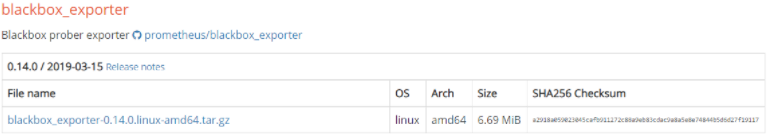
As you can see, at the time of this tutorial, the Blackbox exporter is available on the 0.14.0 version.
Click on the archive to download it. If you are more familiar with wget, copy the link and run this command.
$ wget https://github.com/prometheus/blackbox_exporter/releases/download/v0.14.0/blackbox_exporter-0.14.0.linux-amd64.tar.gz
The archive should be correctly downloaded on your host. To extract the archive, run the following command
$ tar xvzf blackbox_exporter-0.14.0.linux-amd64.tar.gz
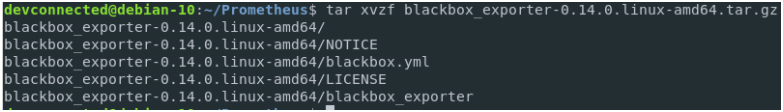
Besides the license and the notice files, the archive contains two important files:
- blackbox_exporter: the executable for the Blackbox exporter. This is the executable that you are going to launch via your service file in order to probe targets;
- blackbox.yml: configuration file for the Blackbox exporter. This is where you are going to define your modules and probers.
Documentation for the blackbox_exporter executable is available when running the following command
$ cd blackbox_exporter-0.14.0.linux-amd64
$ ./blackbox_exporter -h
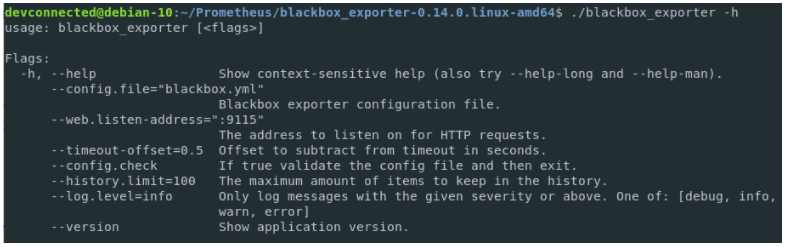
As you can see, the configuration for the Blackbox exporter is pretty straightforward. Those are the flags that we are going to use when defining our systemd service file.
b – Create a service file for the Blackbox exporter
As a meticulous system administrator, you are not going to launch executables from your home directory.
Instead, you are going to define service files and define the start and restart policies for them.
First, make your executables accessible for your user’s local account.
$ sudo mv blackbox_exporter /usr/local/bin
Note: By moving files to the /usr/local/bin path, all users may have access to the blackbox exporter binary. For binaries to be restricted to your own user account, you need to add the path to your own PATH environment variable.
Next, create configuration folders for your blackbox exporter.
$ sudo mkdir -p /etc/blackbox
$ sudo mv blackbox.yml /etc/blackbox
For safety purposes, the Blackbox exporter is going to be run by its own user account (named blackbox here)
As a consequence, we need to create a user account for the Blackbox exporter.
$ sudo useradd -rs /bin/false blackbox
Then, make sure that the blackbox binary can be run by your newly created user.
$ sudo chown blackbox:blackbox /usr/local/bin/blackbox_exporter
Give the correct permissions to your configuration folders recursively.
$ sudo chown -R blackbox:blackbox /etc/blackbox/*
Now that everything is set, it is time for you to create your service file.
To create the Blackbox exporter service, head over to the /lib/systemd/system folder and create a service named blackbox.service
$ cd /lib/systemd/system
$ sudo touch blackbox.service
Edit your service file, and paste the following content into it.
$ sudo nano blackbox.service

[Unit]
Description=Blackbox Exporter Service
Wants=network-online.target
After=network-online.target

[Service]
Type=simple
User=blackbox
Group=blackbox
ExecStart=/usr/local/bin/blackbox_exporter \
  --config.file=/etc/blackbox/blackbox.yml \
  --web.listen-address=":9115"

Restart=always

[Install]
WantedBy=multi-user.target
Note: As you can see, the Blackbox exporter service has no dependencies to other tools of the Prometheus ecosystem or to Prometheus itself.
Save your service file, and make sure that your service is enabled at boot time.
$ sudo systemctl enable blackbox.service
$ sudo systemctl start blackbox.service
For now, the Blackbox exporter is not configured to scrape any targets, but we are going to add a few ones in the next section.
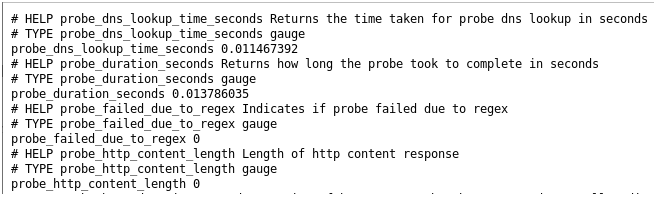
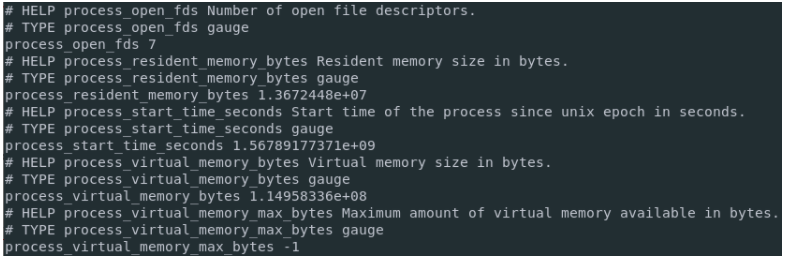
If your service is correctly running, you can check the metrics gathered by issuing a request to the HTTP API.
$ curl http://localhost:9115/metrics
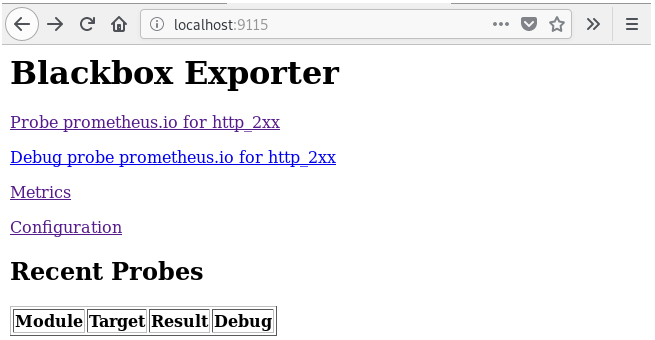
If you navigate to the Blackbox exporter URL with a Web Browser, this is what you should see on your screen.
Now that your Blackbox exporter is gathering metrics, it is time to bind it to Prometheus.
c – Binding the Blackbox exporter with Prometheus
Important Note: In this section, Prometheus is going to scrape the Blackbox Exporter to gather metrics about the exporter itself. To configure Prometheus to scrape HTTP targets, head over to the next sections.
To bind the Blackbox exporter with Prometheus, you need to add it as a scrape target in the Prometheus configuration file.
If you follow the Prometheus setup tutorial, your configuration file is stored at /etc/prometheus/prometheus.yml
Edit this configuration file, and amend the following changes
$ sudo nano /etc/prometheus/prometheus.yml

global:
  scrape_interval:     15s
  evaluation_interval: 15s

scrape_configs:
  - job_name: 'prometheus'
    static_configs:
    - targets: ['localhost:9090', 'localhost:9115']
With Prometheus, you don’t need to restart the systemd service for Prometheus to update.
You can also send a signal to the process for it to restart.
In order to send a SIGHUP signal to your Prometheus process, identify the PID of your Prometheus server.
$ ps aux | grep prometheus
schkn  4431  0.0  0.0  14856  1136 pts/0    S+   09:34   0:00 /bin/prometheus --config.file=...
The PID of my Prometheus process is 4431. Send a SIGHUP signal to this process for the configuration to restart.
$ sudo kill -HUP 4431
Head over to your Prometheus target configuration, and check that you are correctly scrapping your Blackbox exporter.
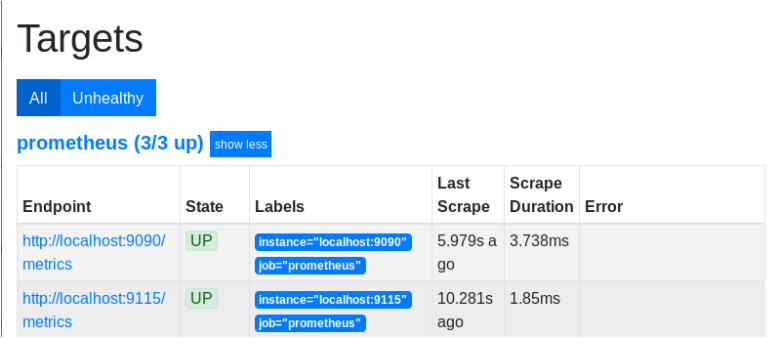
Great!
Now that the Blackbox exporter is configured with Prometheus, it is time to add our first target.
As a matter of simplicity, we are going to monitor the HTTP endpoint of Prometheus itself with the Blackbox exporter.
Monitoring HTTPS endpoints with the Blackbox Exporter
In our setup, Prometheus is now currently sitting behind a reverse proxy (NGINX) configured with self-signed certificates.
This is the endpoint we are going to monitor with the Blackbox Exporter.
a – Creating a Blackbox module
To monitor Prometheus, we are going to use the HTTP prober.
Head over to your Blackbox configuration file, erase its content and paste the following configuration.
modules:
  http_prometheus:
    prober: http
    timeout: 5s
    http:
      valid_http_versions: ["HTTP/1.1", "HTTP/2"]
      method: GET
      fail_if_ssl: false
      fail_if_not_ssl: true
      tls_config:
        insecure_skip_verify: true
      basic_auth:
        username: "username"
        password: "password"
Here are the details of the parameters we chose.
- fail_if_not_ssl: As we are actively monitoring an HTTPS endpoint, we need to make sure that we are retrieving the page with SSL encryption. Otherwise, we count it as a failure;
- insecure_skip_verify: If you followed our previous tutorial, we generated our certificates with self-signed certificates. As a consequence, you are not able to verify it with a certificate authority;
- basic_auth: The reverse proxy endpoint is configured with a basic username/password authentication. The Blackbox exporter needs to be aware of those to probe the Prometheus server.
Save your file, and check your configuration file with the BlackBox binary itself.
$ blackbox_exporter --config.check
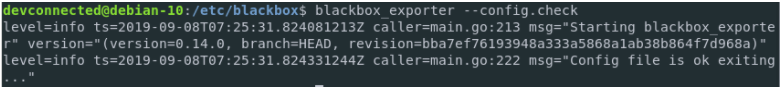
Great!
Our configuration file seems to be correctly formatted.
Again, there is no need to restart the Blackbox Exporter service. Instead, send a simple SIGHUP signal to the process.
Likewise to the Prometheus process, identify the Blackbox exporter PID.
$ ps aux | grep blackbox
devconnected 574  0.0  0.0  14856  1136 pts/0    S+   09:34   0:00 /usr/local/bin/blackbox_exporter --config.file=...
The PID of my Prometheus process is 574.
Send a SIGHUP signal to this process for the configuration to restart.
$ sudo kill -HUP 574
b – Binding the Blackbox Exporter Module in Prometheus
Now that the module is defined, it is time for Prometheus to start actively using it to monitor our target.
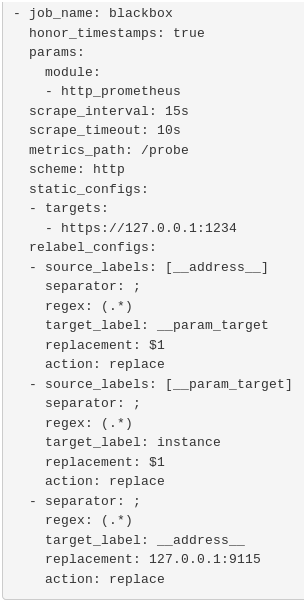
To do so, head over to the Prometheus configuration file, and paste the following changes.
scrape_configs:

...

  - job_name: 'blackbox'
    metrics_path: /probe
    params:
      module: [http_prometheus]
    static_configs:
      - targets:
        - https://127.0.0.1:1234    # Target to probe with https.
    relabel_configs:
      - source_labels: [__address__]
        target_label: __param_target
      - source_labels: [__param_target]
        target_label: instance
      - target_label: __address__
        replacement: 127.0.0.1:9115  # The blackbox exporter's real hostname:port.
Save your changes, and send a SIGHUP signal to Prometheus for it to restart.
When your server has restarted, head over to https://localhost:1234/config and make sure that your changes were correctly saved.
Great!
Prometheus will start scrapping our target now.
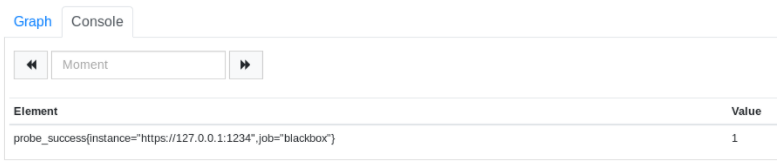
To verify it, head over to the /graph endpoint, and issue the following PromQL request.
probe_success{instance="https://127.0.0.1:1234", job="blackbox"}
If your target is up, the probe success should return 1.
Now that your Blackbox exporter is all set, let’s have a quick Grafana dashboard in order to visualize your results.
Visualizing HTTP metrics on Grafana
a – Installing Grafana on Linux
As always, if you need to install Grafana on your Linux host, make sure to read the dedicated tutorial.
We are not going to create the dashboard by ourselves, instead, we are going to import an existing one that answers our needs.
b – Importing a Grafana dashboard
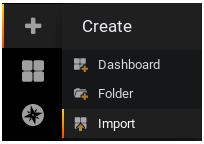
In order to import a Grafana dashboard, click on the “Plus” icon on the left menu, and click on “Import”.
On the next window, select the Grafana.com dashboard option, and type the following dashboard ID: 7587.
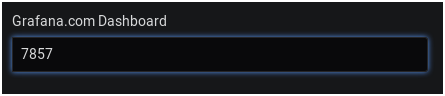
From there, Grafana should automatically detect your dashboard.
Select Prometheus as a datasource, and click on “Import“.
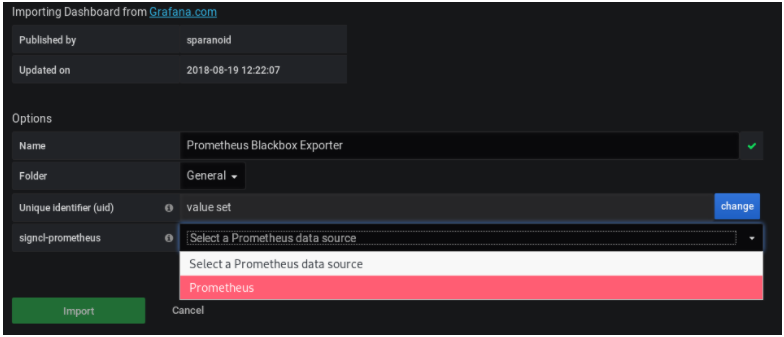
That’s it! By clicking on “Import”, your dashboard was automatically created on Grafana.
This is what you should now see on your screen.
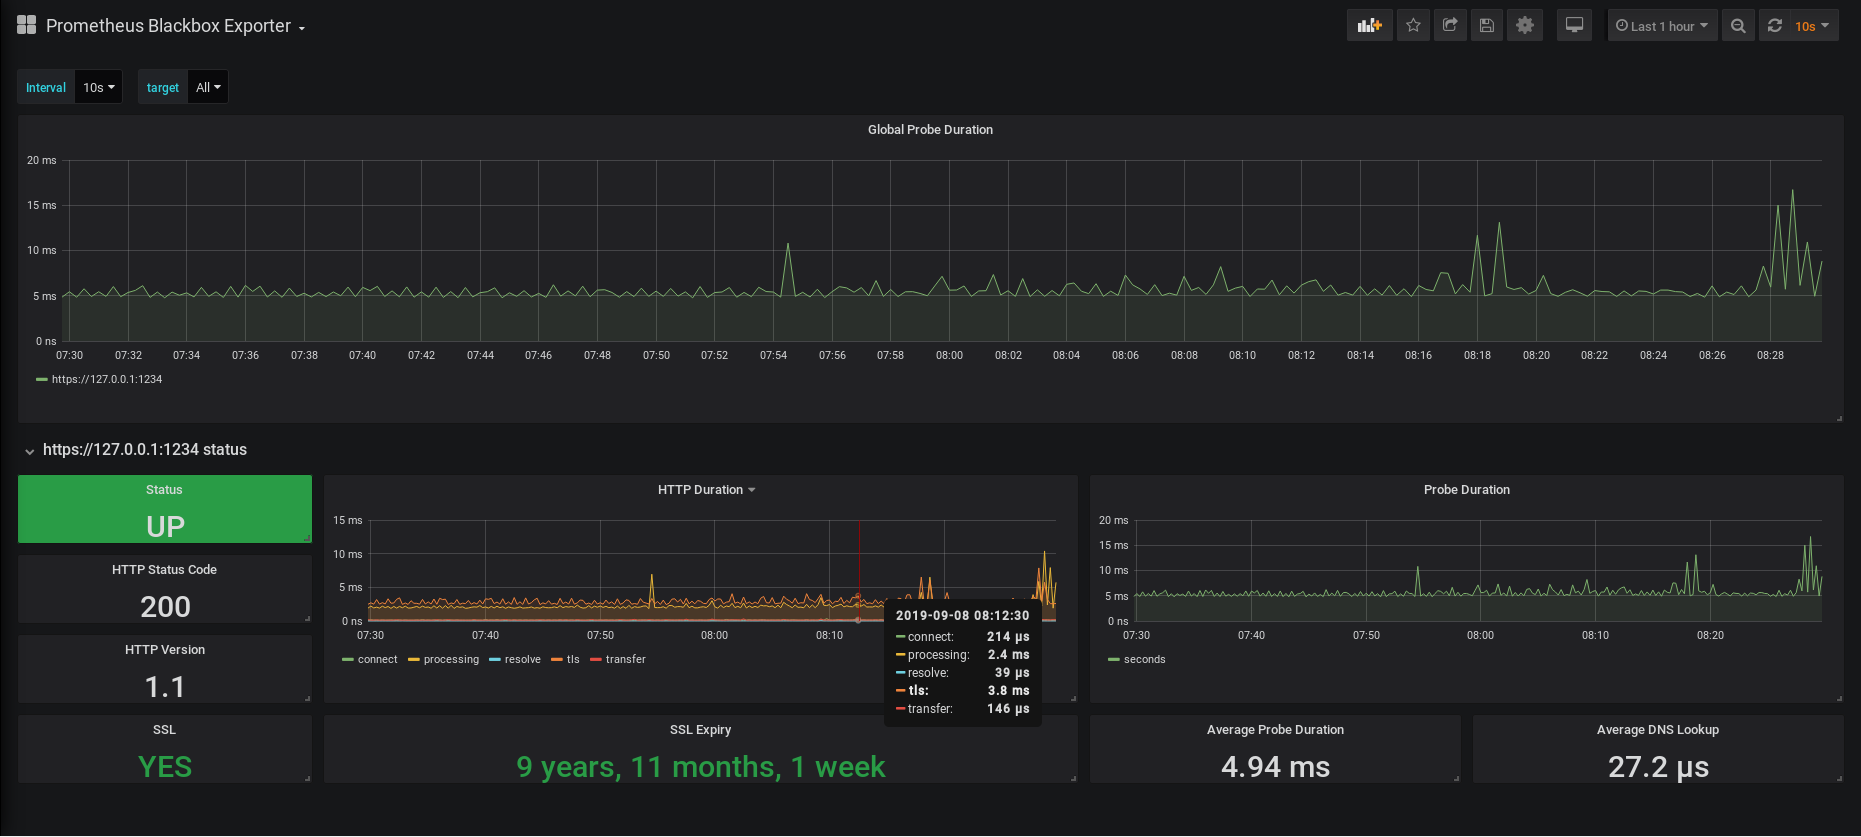
As you can see, this dashboard focuses on HTTP(s) metrics.
You can have metrics about the up status of your website, the current SSL status as well as the SSL expiry date.
You also have graphs showing the current latencies of your HTTP requests, as well as the average DNS lookup time.
It is noteworthy to say that you can choose the target that you want to monitor by clicking on the “Target” dropdown at the top of the dashboard. In our case, we have only one target, but it can become quite handy when you are monitoring several hosts.
Conclusion
Congratulations, you have successfully installed the Blackbox Exporter with Prometheus. Also, you read how you can install Grafana and import your first dashboard.
This tutorial is only the beginning of your learning path on becoming a monitoring expert.
If you are looking for more resources on monitoring guides, we have a complete section dedicated to it check our entire website for better options in learning various techniques & technologies.
I hope that you learned something new today.
Until then, have fun, as always.