Are you worried about monitoring your whole Linux system performance? Do you want to monitor your filesystems, disks, CPUs, also network statistics, likewise you would do with netstat? Also, you are looking for a complete dashboard that displays every single metric on your system efficiently.
This tutorial is the right choice for you all, where it takes a special glance at the Node Exporter, a Prometheus exporter trained in exposing Linux metrics right off the bat. In case, you are a beginner to Prometheus then we would suggest you go through this guide completely and grasp the fundamentals of the awesome time-series database.
After knowing the basics about Prometheus and before starting a build of our entire Linux monitoring system, you all have to know the concepts that will be learning today via this Complete Node Exporter Mastery with Prometheus Tutorial.
- What You Will Learn
- Basics of Linux Monitoring
- Installation of Required Tools
- Building a complete Grafana Dashboard for the Node Exporter
- Getting Inspiration for Dashboards
- Going Further
What You Will Learn
- Existing ways to monitor your Linux system: You will discover about the free and paid tools that you can use in order to quickly monitor your infrastructure
- What is the Node Exporter and how to properly install it as a service
- Bind your Node Exporter with Prometheus and start gathering system metrics
- Play with prebuilt Grafana dashboards to build 100+ panels in one click
After coming to the edge of this tutorial, you will be able to develop your own monitoring infrastructure and add many more exporters to it.
Basics of Linux Monitoring
Before building our entire monitoring architecture, let’s have a look at what are the currently existing solutions and what problems we are trying to solve with the Node Exporter.
Also Check: Complete MySQL dashboard with Grafana & Prometheus
Existing Solutions
As a system administrator, there are multiple ways for you to monitor your Linux infrastructure.
- Command-line tools
There are plenty of command-line tools for you to monitor your system.
- Monitoring Disk I/O on Linux with the Node Exporter
- How To Install Prometheus with Docker on Ubuntu 18.04
- How to Setup Grafana and Prometheus on Linux
They are very known to every system administrator and are often very useful to perform some simple troubleshooting on your instance.
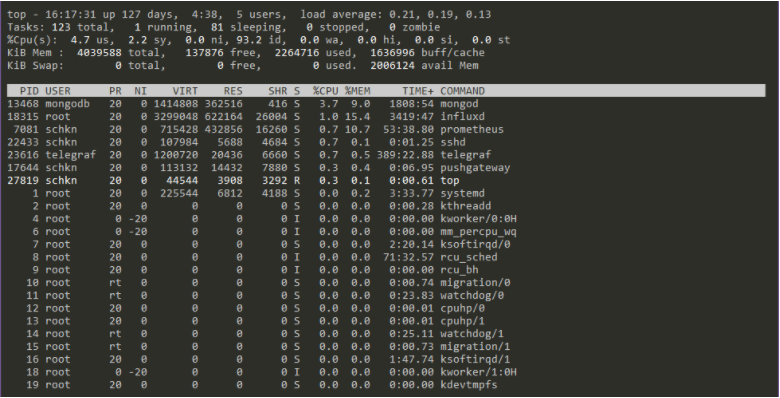
Some examples of command-line tools may be top or htop for the CPU usage, df or du for the disks, or even tcpdump for an easy network traffic analysis.
Those solutions are great but they have major downsides.
Besides being very easy to use, they are often formatted in different ways, making it hard to export them in a consistent way.
Also, to run those commands, you sometimes need elevated privileges on the system which is not always the case.
With a complete monitoring system, you can have the security rules handled directly in your dashboarding system (for example Grafana) and you don’t need to provide direct access to your instance to whoever wants to troubleshoot outages.
- Desktop solutions
Desktop solutions provide a more consistent and probably more practical solution to system monitoring.
Some examples of those tools are the very established SolarWinds Linux Performance Monitoring Tool (that provides very complete dashboards for your Linux system) or Zabbix with the Metric Collection product.
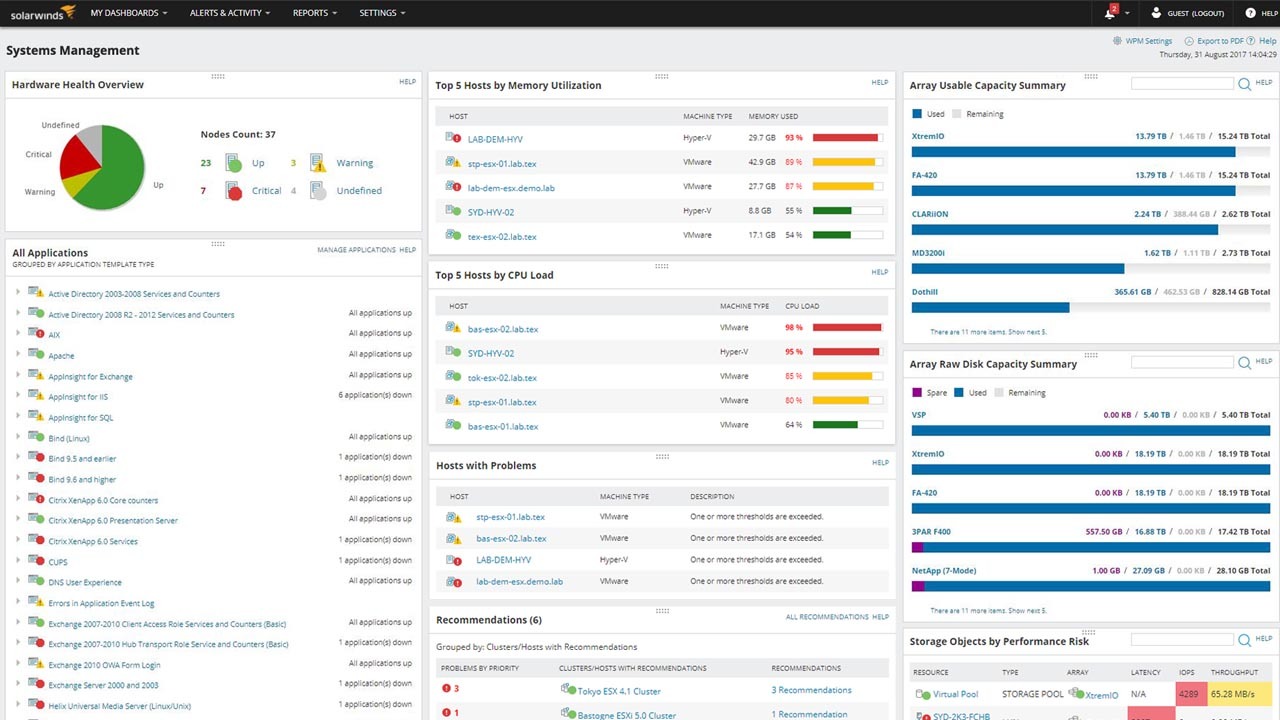
The Linux Performance Monitoring Tools by SolarWinds is a paid tool, but if you want a solution ready to use very quickly, they are a great opportunity for your Linux monitoring.
Node Exporter & Prometheus
Now that we know what the existing tools for Linux monitoring are, let’s have a look at what we are going to use today: the node exporter and Prometheus.
As stated before, Prometheus scrapes targets and the node exporter is just one of them.
In your architecture, you will have the following components:
- A time-series database, in this case, Prometheus made to store the different metrics retrieved by the node exporter
- A Node Exporter run as a systemd service that will periodically (every 1 second) gathers all the metrics of your system.
- A dashboard solution, in this case, Grafana, displaying metrics gathered from Prometheus. We are not going to build every single panel by ourselves. Instead, we are going to use a very powerful feature of Grafana which is the dashboard import. (as a reminder, Grafana has a list of hundreds of dashboards that you import within the UI)
In our case, the whole stack will be run within the same instance, so there will be no need to configure any firewall rules.
The node exporter will run on port 9100 and Prometheus will run on port 9090
Note : as part of the configuration, Prometheus can actually monitor itself.
Now that you have an idea of what a monitoring architecture looks like, let’s install the different tools needed.
Installation of Required Tools
As a reminder, for our architecture, we are going to need Prometheus, the Node Exporter, and Grafana.
This tutorial focuses on installing the node exporter completely, but there’s also a quick installation for other tools.
Installing the Node Exporter
Before installing Prometheus, we need to install the Node Exporter as a service.
Head to and download the latest binary for the node exporter (here 0.18.1)
$ wget https://github.com/prometheus/node_exporter/releases/download/v0.18.1/node_exporter-0.18.1.linux-amd64.tar.gz
The archive contains a single binary which is node_exporter.
This is the binary we are going to launch to start gathering metrics on our system.
Now that you have the archive, extract it, and inspect its content it.
$ tar xvzf node_exporter-0.18.1.linux-amd64.tar.gz
Now to install it as a service, here are the instructions:
- Create a node exporter user
$ sudo useradd -rs /bin/false node_exporter
- Copy the binary to your /usr/local/bin folder.
$ cp node_exporter-0.18.1.linux-amd64/node_exporter /usr/local/bin
- Apply the correct permissions to your binary file.
$ chown node_exporter:node_exporter /usr/local/bin/node_exporter
Note: you will need to have a node_exporter user to run the binary.
- Navigate to /etc/systemd/system and create a new service file
$ cd /etc/systemd/systemd
$ sudo vim node_exporter.service
Then, paste the following configuration for your service.
[Unit]
Description=Node Exporter
After=network-online.target

[Service]
User=node_exporter
Group=node_exporter
Type=simple
ExecStart=/usr/local/bin/node_exporter

[Install]
WantedBy=multi-user.target
- Exit vi, reload your daemon and start your service.
$ sudo systemctl daemon-reload
$ sudo systemctl start node_exporter
- Check your service by running the following command
$ sudo systemctl status node_exporter.service
Is your service running correctly?
- Enable your service for system startup
$ sudo systemctl enable node_exporter
- Verify that your node exporter is correctly up and running with a simple curl command
$ curl http://localhost:9100/metrics
Can you see the key-value pairs metrics of your system metrics?
We are done with the Node Exporter installation!
Installing Prometheus
It is not the first time we install Prometheus for our projects.
First, head over to and run a simple wget command to get the latest binaries.
$ wget https://github.com/prometheus/prometheus/releases/download/v2.10.0/prometheus-2.10.0.linux-amd64.tar.gzFor this tutorial, we are running the 2.10.0 version from May 2019.
You should now have an archive, extract it, and navigate inside the folder.
# tar xvzf prometheus-2.10.0.linux-amd64.tar.gz
# cd prometheus-2.10.0.linux-amd64/
Inside this folder, you have multiple elements:
- Prometheus: the executable file that launches a Prometheus server;
- prometheus.yml: the configuration file for your Prometheus server;
- promtool: a tool that can be used to check your Prometheus configuration.
In our case, we are first going to modify the Prometheus configuration file.
Navigate in it with vi:
# vi prometheus.yml
Then perform the following modifications:
global:
  scrape_interval:     1s # Set the scrape interval to every 1 second.
As a reminder, Prometheus scrapes targets. In our case, we want it to scrape our system metrics every one second.
Then, in the “scrape_configs” section, under the “static_configs” section, add the following lines.
static_configs:
            - targets: ['localhost:9090', 'localhost:9100']
It means that Prometheus will scrape the node exporter metrics, as well as its own metrics.
For now, simply launch Prometheus as a background process, and verify that it is correctly launched by pinging the Web UI interface.
> ./prometheus &
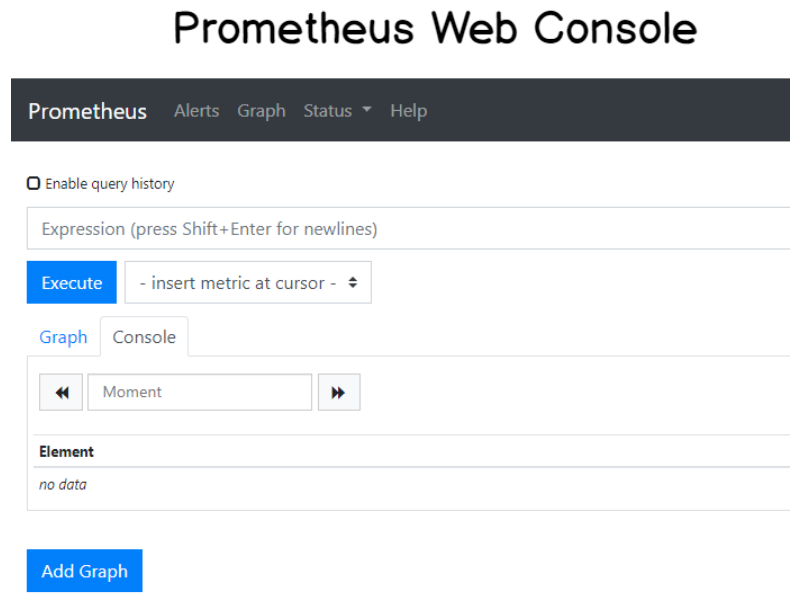
Can you see the web console?
We are done with the Prometheus setup!
Installing Grafana
The last part of our initialization section is about installing Grafana.
As a reminder, Grafana is an open-source dashboard monitoring solution that binds to databases in order to display metrics in a variety of ways.

To install Grafana, head over to https://grafana.com/grafana/download and download the latest binaries available for you.
$ wget https://dl.grafana.com/oss/release/grafana_6.2.4_amd64.deb
For this tutorial, we are using the 6.2.4 version of Grafana that includes the new bar gauges.
Extract the .deb file and Grafana should automatically start as a service on your computer.
$ sudo dpkg -i grafana_6.2.4_amd64.deb
You can verify that Grafana is running with the following command:
$ sudo systemctl status grafana-server
● grafana-server.service - Grafana instance
   Loaded: loaded (/usr/lib/systemd/system/grafana-server.service; disabled; vendor preset: enabled)
   Active: active (running) since Thu 2019-06-22 10:43:12 UTC; 5 days ago
     Docs: http://docs.grafana.org
If the status is set to Active, and if no visible errors are shown in your console, then Grafana is now installed correctly on your machine.
By default, Grafana is running on port 3000, and the default credentials are
- username: admin
- password: admin
You will be asked to change them immediately on the first connection.
With a web browser, head over to http://localhost:3000, and follow the instructions until you see the welcome screen.
As described in the screenshot, click on ‘Add data source‘ and create a new Prometheus data source.
As described in our other tutorials, you can configure your data source with the following configuration:
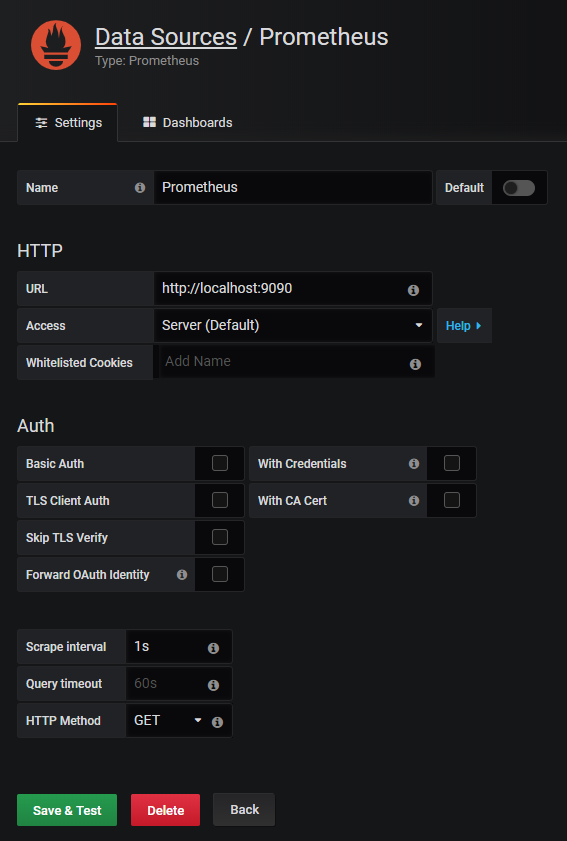
Note: If you configured your Prometheus instance to run on another port, you have to change it in the configuration.
Building a complete Grafana Dashboard for the Node Exporter
Now that all your tools are set, there is not much work to do in order to have our dashboards.
For this, we are not going to build our dashboards by ourselves. Instead, we are going to use the “Import Dashboard” feature of Grafana.
In the top left menu, hover your mouse over the “Plus” icon and click on the “Import” element in the dropdown list.
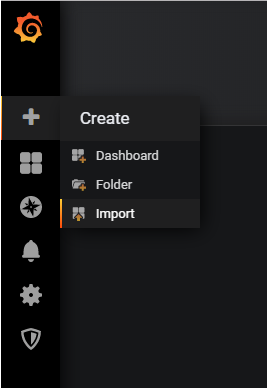
You will be presented with the following window:
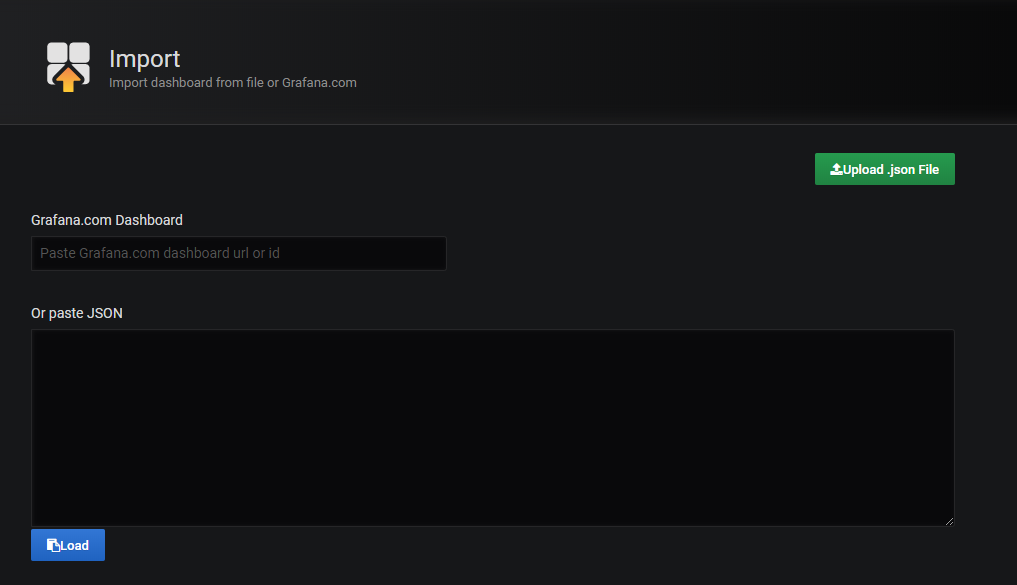
In this window, you have multiple choices. You can either:
- Type a dashboard URL or ID and it will be automatically imported into your Grafana instance.
- Upload a JSON file (as a quick reminder, Grafana dashboards are exported as JSON files and can be easily shared this way)
- Paste directly the raw JSON
In our case, we are going to use the first option by typing the dashboard id directly in the text field.
Getting Inspiration for Dashboards
We don’t have to build the dashboards all by ourselves.
This is especially true when you have dozens of metrics to look for.
You would have to spend a lot of time understanding the different metrics and building panels out of them.
We are going to use Grafana Dashboards for this. Grafana Dashboards is a repository owned by Grafana that stores hundreds of dashboards for you to choose from.
In our case, we are going to focus on Node Exporter dashboards.
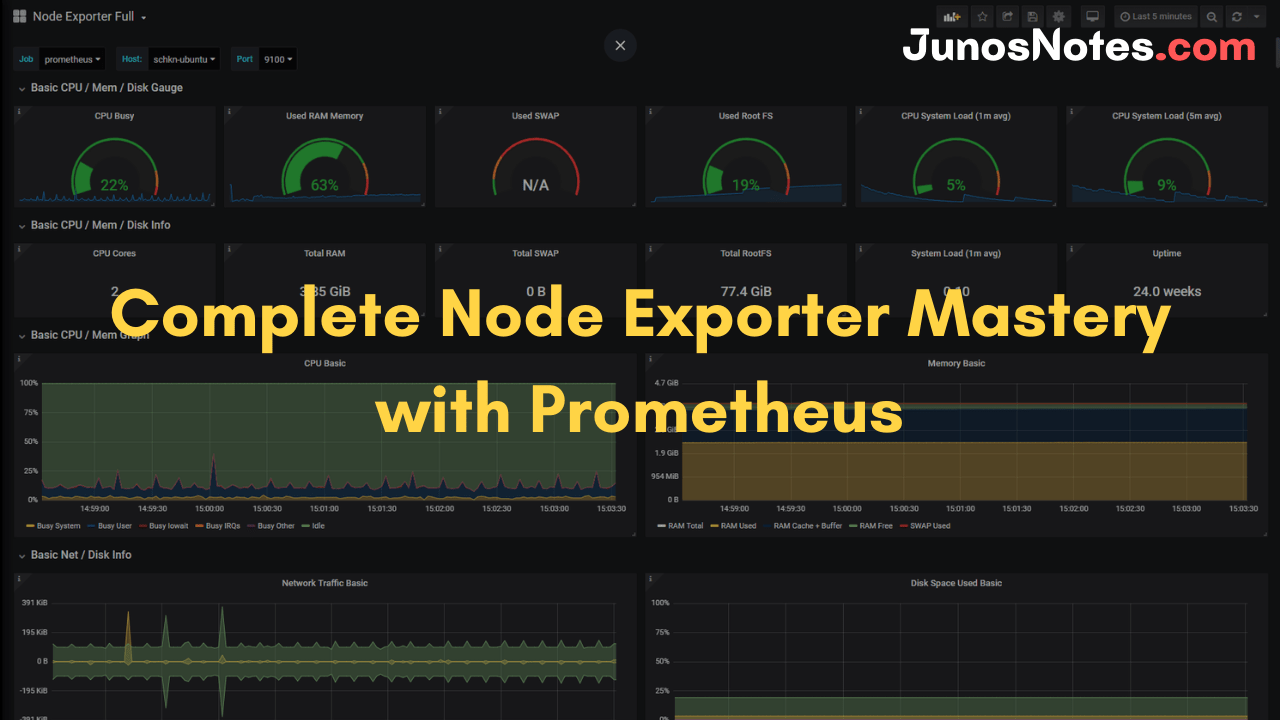
Type “Node Exporter” in the search box and scroll until you reach the “Node Exporter Full” dashboard.
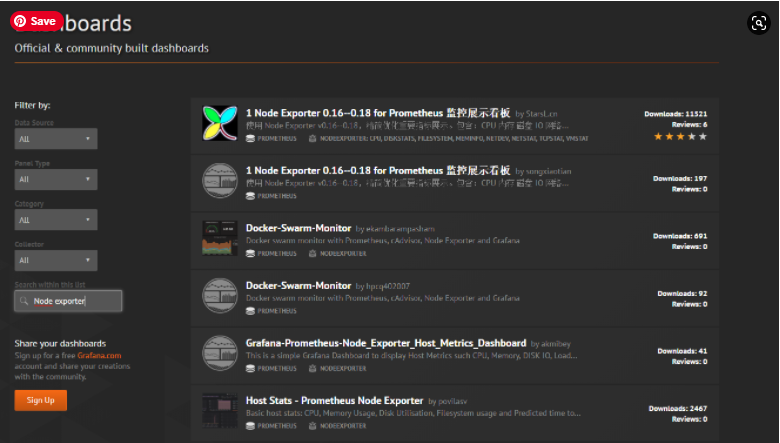
As you probably noticed it, the dashboard has the ID 1860 (the information is available into the URL of the website).
This is the ID that we are going to copy in order to monitor our system.
In the import, type “1860” in the Grafana.com dashboard text field, and hit “Load”.
You will be presented with a second screen to configure your dashboard.
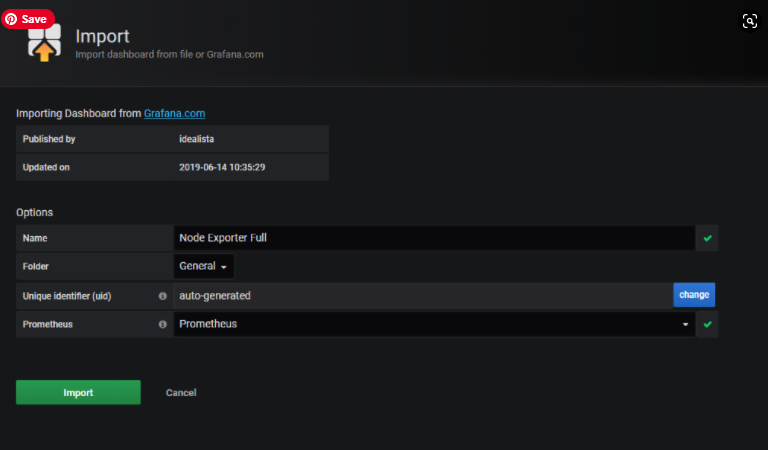
Every field is filled automatically.
However, you will have to select the data source, in my case “Prometheus“. (you have to link it to the data source you created in section 2)
Hit “Import” when you are done.
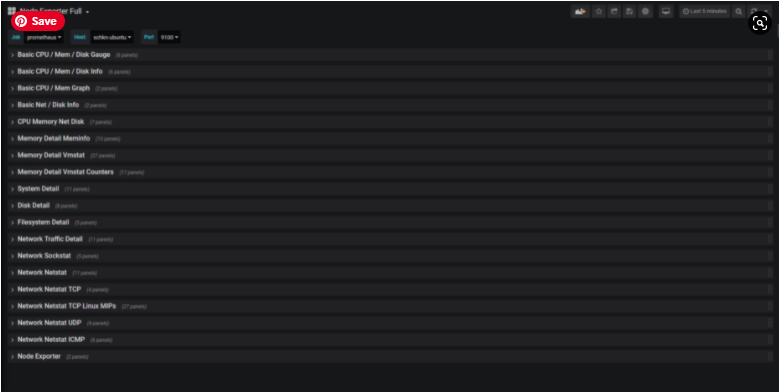
In under a second, all the different panels will be built for you!
That’s 29 categories with over 192 panels created automatically. Awesome.
Here are some examples of how the dashboards look:
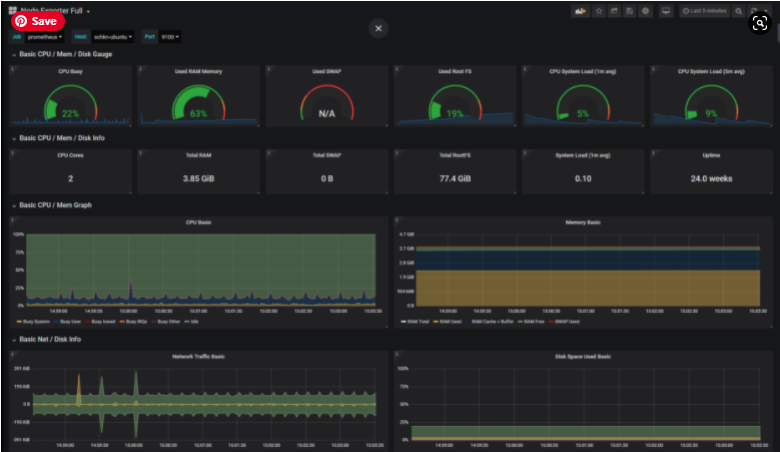
You can also have a look at all the options available in this whole panel.
Going Further
Mastering the Node Exporter is definitely a must-have skill for engineers willing to get started with Prometheus.
However, you can dig a little bit deeper using the Node Exporter.
a – Additional Modules
Not all modules are enabled by default, and if you run a simple node exporter installation, chances are that you are not running any additional plugins.
Here’s the list of the additional modules:
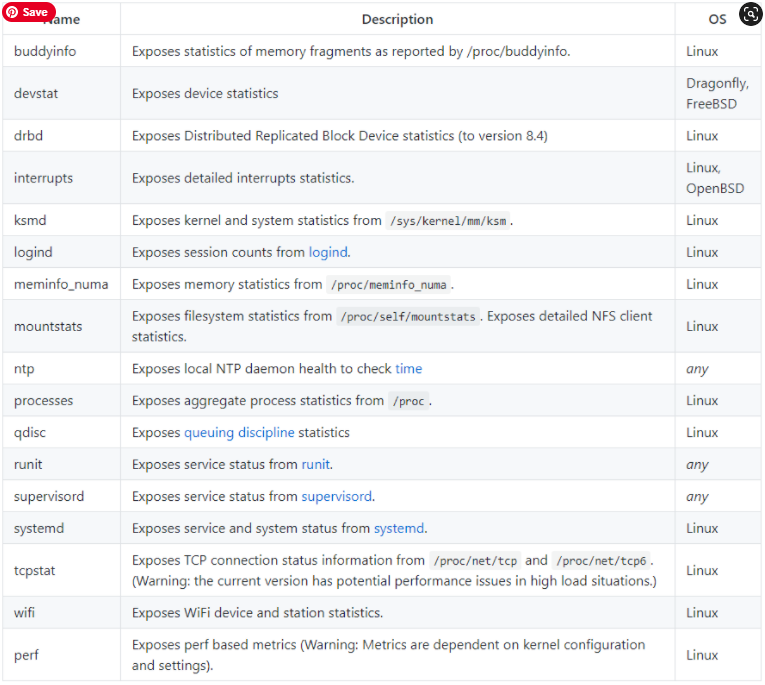
In order to activate them, simply add a –collector.<name> flag when running the node exporter, for example:
ExecStart=/usr/local/bin/node_exporter --collector.processes --collector.ntp
This should activate the processes and the ntp collectors.
b – TextFile Collector
A complete Node Exporter guide would not be complete without talking about the TextFile collector, at least for a small section.
Similar to the Pushgateway, the textfile collector collects metrics from text files and stores them right into Prometheus.
It is designed for batch jobs or short-lived jobs that don’t expose metrics in a continuous way.
Some examples of the textfile collector are available here:
- Using the text file collector from a shell script.
- Monitoring directory sizes with the textfile collector.
c – Videos Resources
Finally, I like to link to external videos that are closely related to the subject or particularly interesting.