If you play an important role as a system administrator or a database administrator, then monitoring your MySQL server is also a very crucial move towards diagnosing problems. To do such actions, you need real-time monitoring on active connections, locks, or queries which are operating on your database. Along with that, you also require active users in addition to average query times.
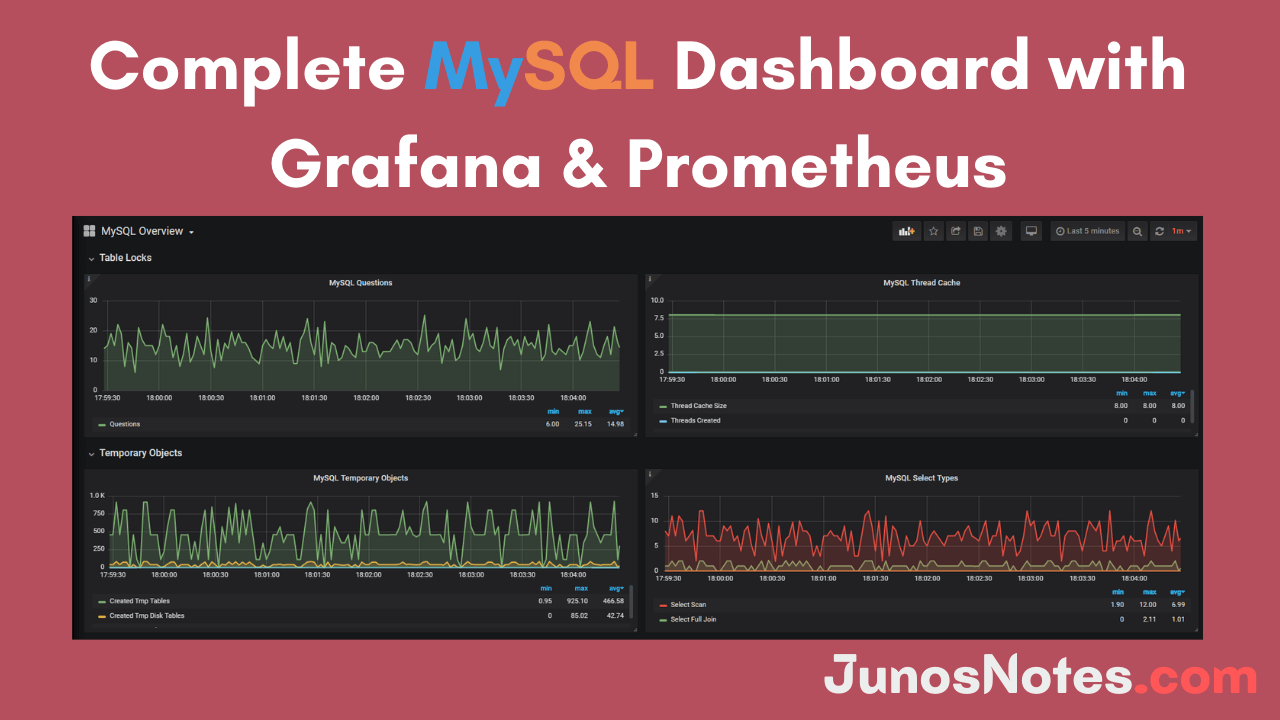
In order to perform monitoring on such metrics, we are planning to create a complete MySQL dashboard with the help of advanced software tools like Grafana and Prometheus.
If you stick with this Complete MySQL dashboard with Grafana & Prometheus tutorial, you will definitely learn how to build this dashboard and be performed with a collection of 10+ MySQL dashboards designed by Percona. Furthermore, You can bet that there will be a dashboard for your requirements!
- MySQL, Grafana & Prometheus Architecture
- Steps to Install Different Tools for MySQL Database Monitoring with Grafana and Prometheus
- Installing Prometheus
- Installing the MySQL exporter
- Creating a MySQL exporter service
- Configuring Prometheus
- Installing Grafana
- How to Create the MySQL dashboard with Grafana
- Configuring Prometheus data source
- Going Further with MySQL and Grafana
What You Will Learn
The concepts that learners can follow from this tutorial are listed below:
- What a basic Prometheus monitoring architecture looks like;
- How to install and configure a Prometheus server on your Linux machine;
- How to configure Grafana to import Percona’s MySQL dashboards in minutes.
- How to set up the MySQL server exporter and how to bind it to Prometheus;
Enthusiastic to start learning?
- MongoDB Monitoring with Grafana & Prometheus | Mongodb Prometheus Grafana Dashboard
- Complete Node Exporter Mastery with Prometheus | Monitoring Linux Host Metrics WITH THE NODE EXPORTER
- Monitoring Linux Processes using Prometheus and Grafana | Prometheus & Grafana Linux Monitoring
MySQL, Grafana & Prometheus Architecture
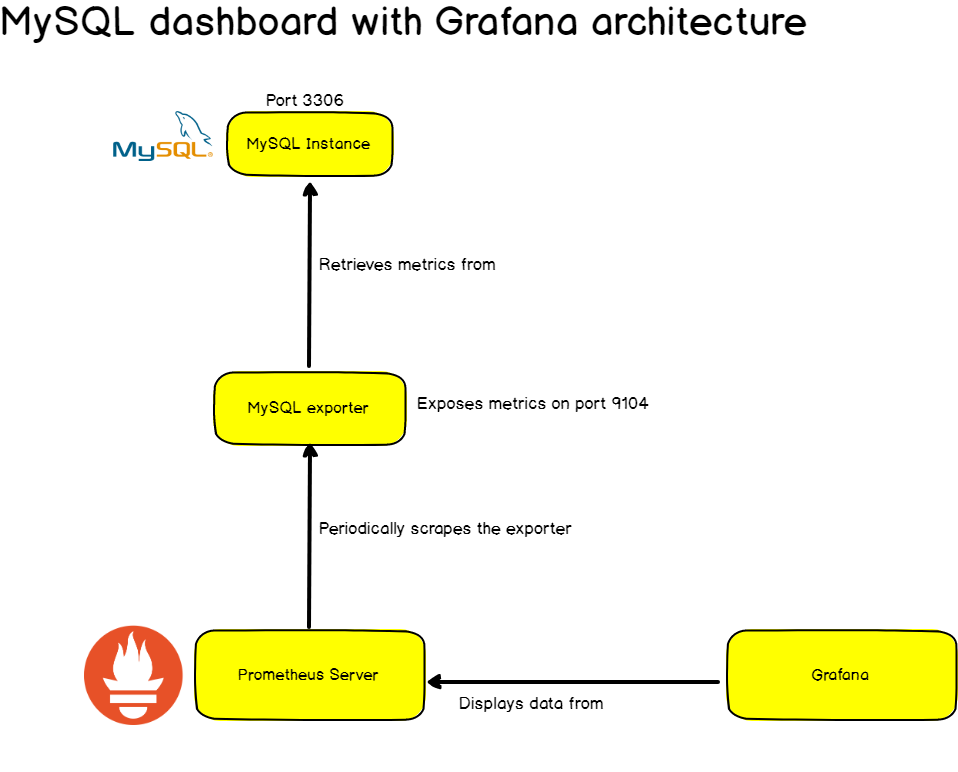
Before beginning to learn MySQL Database Monitoring using Grafana and Prometheus, you should aware of what a Prometheus monitoring architecture looks like:
Our definitive guide on Prometheus will make you a clear idea on Prometheus works with exporters. Exporters are meant to bind to existing data sources to retrieve metrics from them. For instance, exporters would be the MongoDB exporter, the ElasticSearch exporter, or in our case the MySQL exporter.
Exporters are revealed as Docker images or as standalone binaries that you can run as background tasks or services. But here, we are using the MySQL exporter that is available on Prometheus’s official Github page.
The MySQL exporter binds to our MySQL instance and exposes metrics straight for Prometheus to apply.
As part of its configuration, Prometheus is going to bind to it and scrape metrics from it. From there, they will be noticeable on Grafana.
Also Check: How To Install and Configure Debian 10 Buster with GNOME
Quite easy, right?
Now that you better understand how we will build it, let’s install all the tools you need to create your MySQL dashboard with Grafana.
Steps to Install Different Tools for MySQL Database Monitoring with Grafana and Prometheus
- Install and configure Grafana
- Install and configure Prometheus
- Install a MySQL exporter
- Creating a MySQL exporter service
Installing Prometheus
For those who are new to Prometheus, we covered Prometheus installation in our previous tutorial.
From this point, your Prometheus instance should be up and running with your configuration files on /etc/prometheus/prometheus.yml.
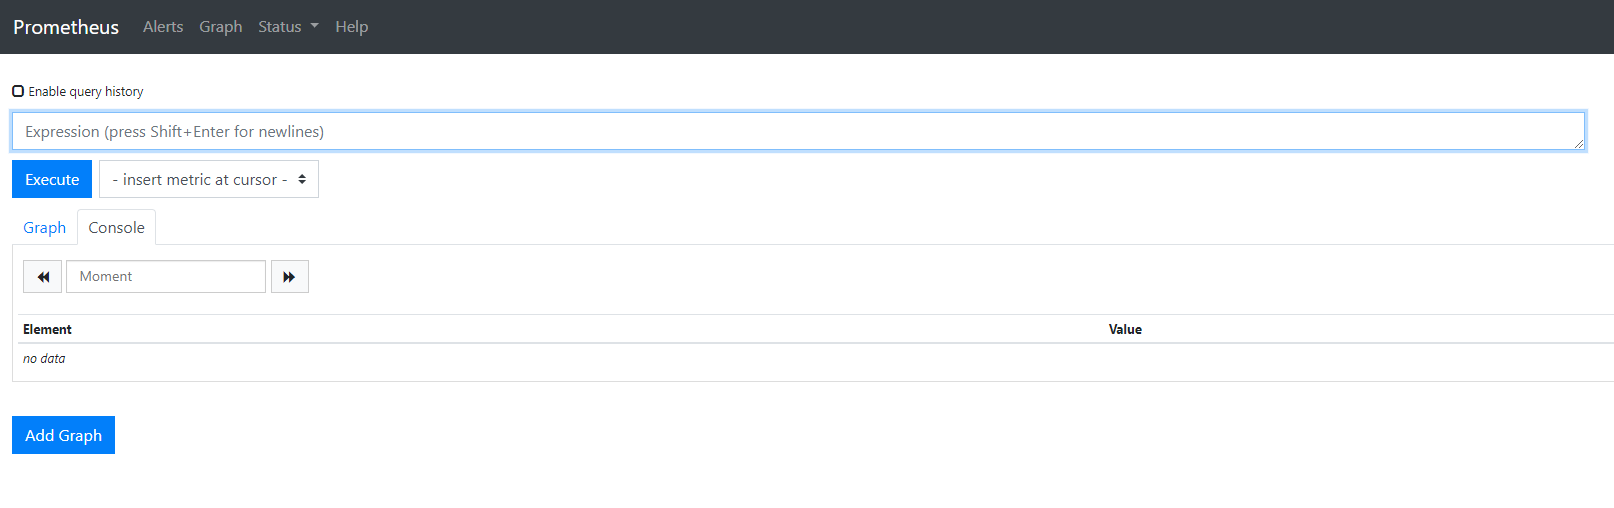
To verify it, head over to http://localhost:9090. You should see the Prometheus web interface running. If not, something is definitely wrong with your installation.
 For now, no metrics are currently stored in your Prometheus instance because we did not set the MySQL exporter.
That’s what we are going to do next.
Installing the MySQL exporter
As detailed before, the MySQL exporter is available here. It is actually an official exporter created by Prometheus itself.
The MySQL exporter comes as a standalone binary, but we are going to configure it as a service.
First, create a Prometheus user on your instance if it is not already existing.
> sudo useradd -rs /bin/false prometheus
As a quick reminder, with this command, you will create a system (-r) user named Prometheus with a no shell access (-s) This is the user you will use to create your MySQL exporter service.
First, download the latest MySQL exporter binaries on your instance.
All distributions are available here. Find the one that suits your needs and run:
> wget https://github.com/prometheus/mysqld_exporter/releases/download/v0.11.0/mysqld_exporter-0.11.0.linux-amd64.tar.gz
Now that your binaries are download, extract them in your current folder.
> tar xvzf mysqld_exporter-0.11.0.linux-amd64.tar.gz
Move the binaries to the /usr/local/bin folder that we are going to build a service out of it. You need sudo rights to perform this operation.
> cd mysqld_exporter-0.11.0.linux-amd64/
> sudo mv mysqld_exporter /usr/local/bin/
From there, you should be able to create a user for the exporter on your MySQL database.
Run the MySQL shell, and configure your database as follows (you should have the rights to grant permissions on your database).
> sudo mysql
> CREATE USER 'exporter'@'localhost' IDENTIFIED BY 'password' WITH MAX_USER_CONNECTIONS 3;
> GRANT PROCESS, REPLICATION CLIENT, SELECT ON *.* TO 'exporter'@'localhost';
Running those commands, you will create an exporter user with a ‘password’ password on MySQL. Now, you are going to set those variables in a configuration file.
In your /etc folder, create a new configuration file named .exporter.cnf and write the following credentials to it.
> cd /etc
> sudo vi .exporter.cnf
Set the credentials in the configuration file as follows:
[client]
user=exporter
password=password
(If you set different users or passwords in the step before, you need to reflect the changes in the configuration file.)
Creating a MySQL exporter service
Now that everything is ready, it is time to create a service for your MySQL exporter. Head over to /lib/systemd/system and create a new service file.
<pre> sudo vi /lib/systemd/system/mysql_exporter.service
Paste the following configuration into it:
[Unit]
Description=MySQL Exporter
User=prometheus

[Service]
Type=simple
Restart=always
ExecStart=/usr/local/bin/mysqld_exporter \
--config.my-cnf /etc/.exporter.cnf \
--collect.auto_increment.columns \
--collect.binlog_size \
--collect.engine_innodb_status \
--collect.engine_tokudb_status \
--collect.global_status \
--web.listen-address=0.0.0.0:9104

[Install]
WantedBy=multi-user.target
Restart your system daemon and start your service.
> sudo systemctl daemon-reload
> sudo systemctl status mysql _exporter.service
Check that your service is running by issuing the following command:
> sudo systemctl status mysql_exporter
● mysql_exporter.service - MySQL Exporter
   Loaded: loaded (/lib/systemd/system/mysql_exporter.service; disabled; vendor preset: enabled)
   Active: active (running) since Sat 2019-06-08 15:11:12 UTC; 5min ago
 Main PID: 3136 (mysqld_exporter)
    Tasks: 8 (limit: 4704)
   CGroup: /system.slice/mysql_exporter.service
           └─3136 /usr/local/bin/mysqld_exporter --config.my-cnf /etc/.exporter.cnf
Congratulations!
Your MySQL exporter is all set. Now it is time to configure Prometheus to scrape it.
Quick note: your MySQL exporter runs on port 9104 and MySQL runs on port 3306 by default.
Configuring Prometheus
Prometheus scrapes targets via its configuration file. As we added a new exporter, let’s add it to the Prometheus configuration.
Head over to the location of your Prometheus configuration file and edit it as follows:
# A scrape configuration containing exactly one endpoint to scrape:
# Here it's Prometheus itself.
scrape_configs:
  # The job name is added as a label `job=<job_name>` to any timeseries scraped from this config.
  - job_name: 'prometheus'
    static_configs:
            - targets: ['localhost:9090', 'localhost:9104']
Restart Prometheus, and head over to Prometheus Web Interface (http://localhost:9090).
Go to the targets tab, and make sure that Prometheus is correctly scrapping the MySQL exporter target.
Back to the ‘graph’ tab, in the expression text field, type ‘mysql_exporter_scrapes_total‘. If you see a result there, it means that your Prometheus instance is correctly configured to extract metrics from the exporter.
Congratulations! The entire configuration is now done!
Installing Grafana
Grafana will be used to display our metrics. The steps to install Grafana were detailed in one of our articles already, make sure to read it before you continue.
Click Here: How To Create a Grafana Dashboard? (UI + API methods)
If you are looking for a tutorial to install it on Ubuntu 18.04, I wrote a detailed Grafana installation guide for Ubuntu users.
How to Create the MySQL dashboard with Grafana
In this case, you have essentially two choices:
- Create your own customized Grafana dashboard: tailored to your needs, you can choose what metrics you want to display and how you want to display them.
- Use existing community dashboards and save some time.
In this tutorial, we are going to go for option two. We are going to use awesome Percona MySQL dashboards and import them right into our Grafana.
Configuring Prometheus data source
Before starting, and if you did not do it already, you need to configure Prometheus as a Grafana data source.
Create a new data source, and configure it as follows:
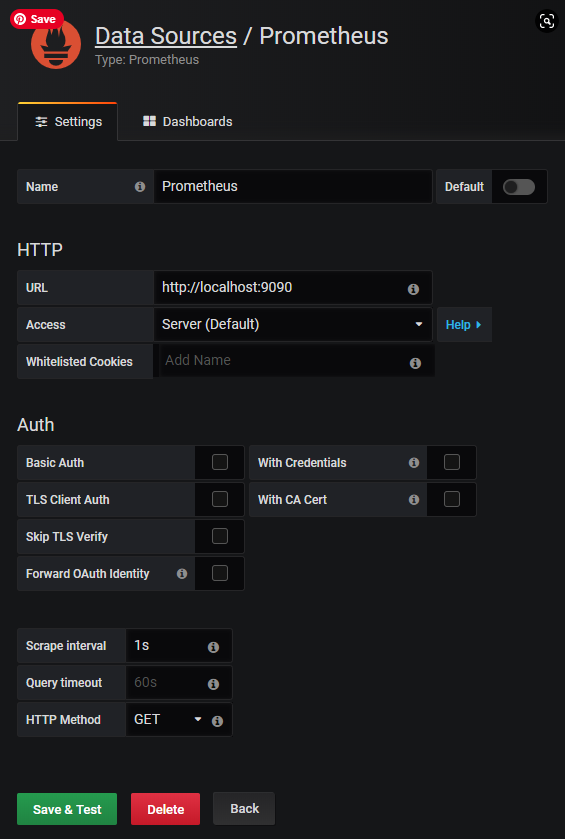
If your Prometheus instance is not running on port 9090 by default, make sure to write the correct port in the configuration.
Now that Prometheus is configured, we can browse Percona’s existing dashboards and import one of the existing MySQL dashboards in Grafana.
Percona dashboards are available here. You can also play with the existing dashboards on Percona’s own Grafana instance here.
In the dashboards folder of Percona’s GitHub, download the json file that you are interested in.
> wget https://github.com/percona/grafana-dashboards/blob/master/dashboards/MySQL_Overview.json
Now that your dashboard is downloaded, in Grafana, go to Dashboards > Import > Upload .json file.
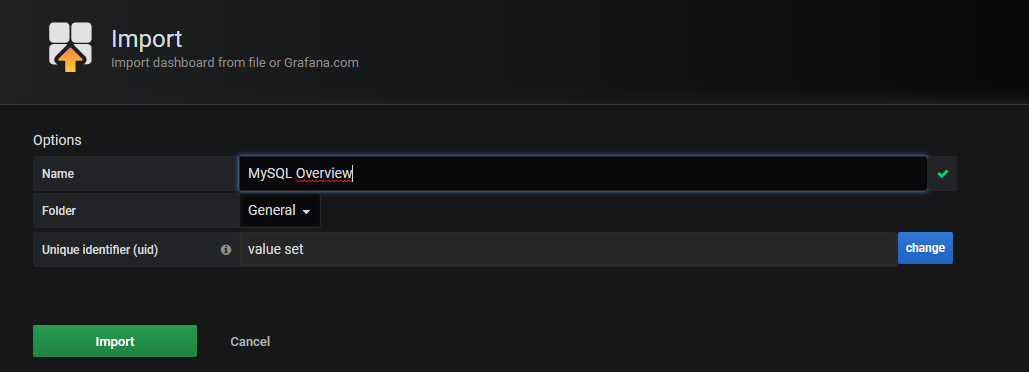
If you press “Import”, your entire MySQL dashboard will be created automatically and it will start displaying data immediately!
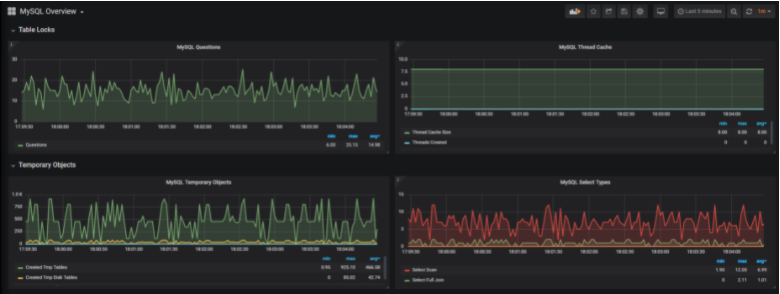
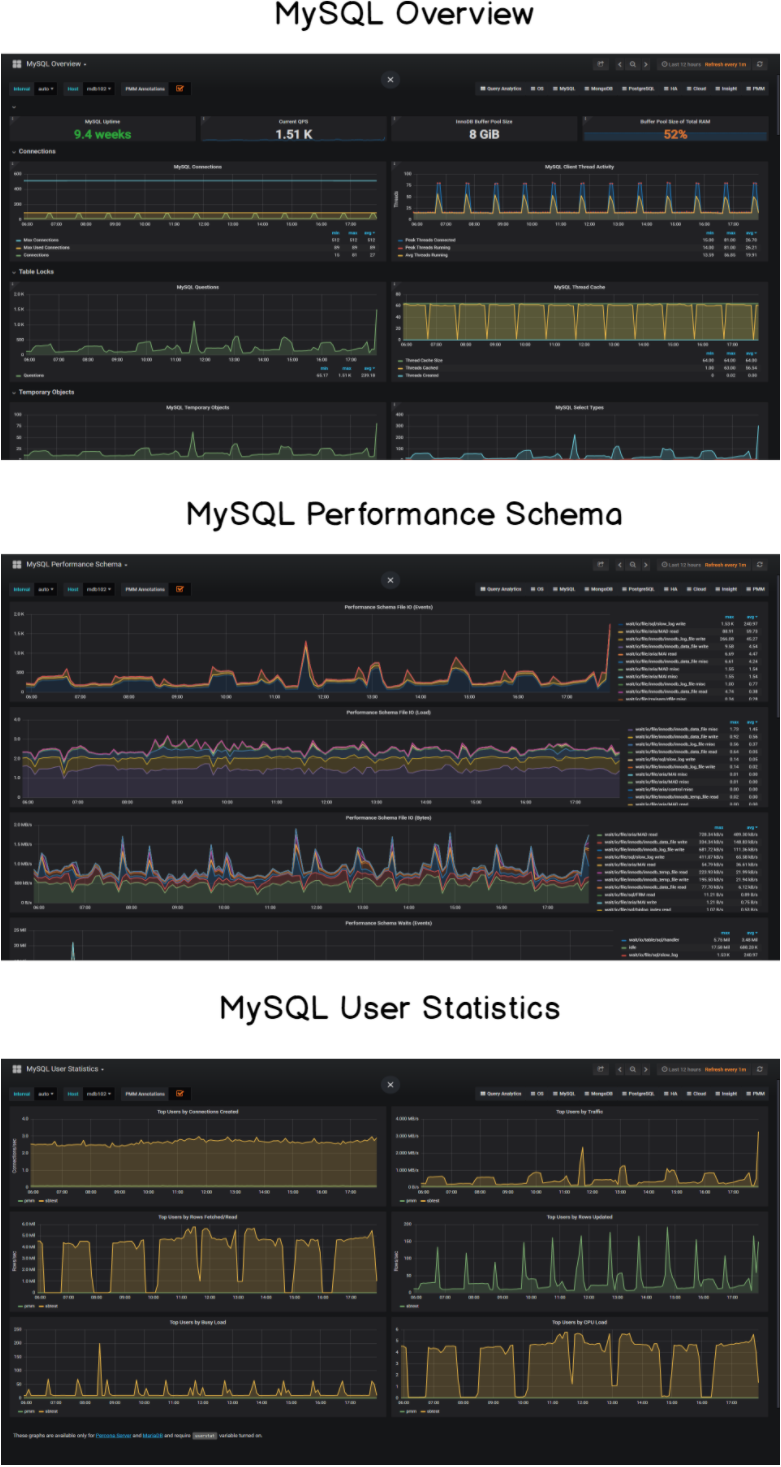
This is the MySQL overview dashboard, but there are more than 20+ dashboards for you to choose from.
Here the complete list of dashboards created by Percona:
Saves a set of Grafana dashboards for database and system monitoring using Prometheus data source.
- Amazon RDS OS metrics (CloudWatch data source)
- Cross-Server Graphs
- Disk Performance
- Disk Space
- MongoDB Cluster Summary
- MongoDB Overview
- MongoDB ReplSet
- MongoDB RocksDB
- MongoDB Wired Tiger
- MongoDB MMAPv1
- MongoDB InMemory
- MySQL InnoDB Metrics
- MySQL InnoDB Metrics Advanced
- MySQL InnoDB Compression
- MySQL MYISAM/Aria Metrics
- MySQL Overview
- MySQL Performance Schema
- MySQL Query Response Time
- MySQL Replication
- MySQL Table Statistics
- MySQL TokuDB Graphs
- MySQL User Statistics
- MySQL Command Handler Counters Compare
- PXC/Galera Cluster Overview
- PXC/Galera Graphs
- Prometheus
- ProxySQL Overview
- Summary Dashboard
- System Overview
- Trends Dashboard
Going Further with MySQL and Grafana
If you want to dig a little bit more into the subject, many videos can help you have an in-depth understanding of how companies are building dashboards, especially MySQL dashboards with Grafana.
Very recently, in February 2019, Peter Zaitsev (CEO at Percona) made a very great talk about it. The entire business model of Percona is built on monitoring MySQL, MongoDB, and MariaDB at scale.
A second use-case is Verizon using Grafana and MySQL and demonstrated how it can optimize automation and self-service practically.
I hope that you learned something new today. If you did, make sure to leave us a comment on how you plan on using this knowledge to your own specific needs.
Until then, have fun, as always.