Want to install InfluxDB technology on your Linux OS? Then, you have stepped to the right page. From here, you will learn what is InfluxDB and how to install and configure it on Linux. Let’s jump into the basics first!
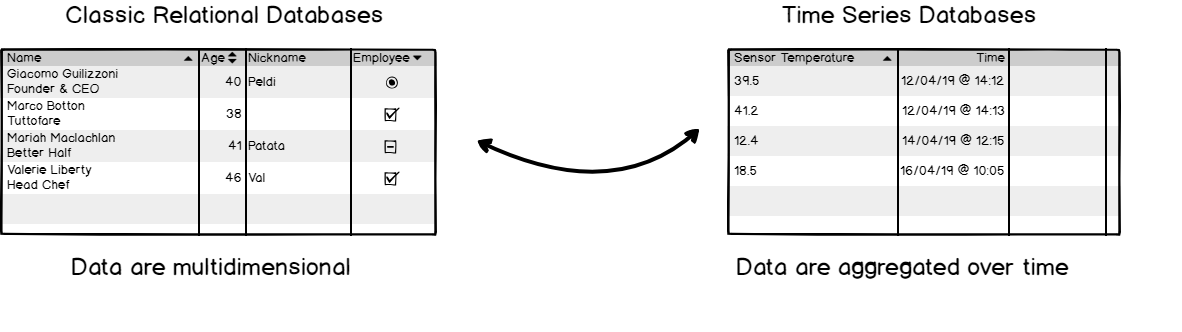
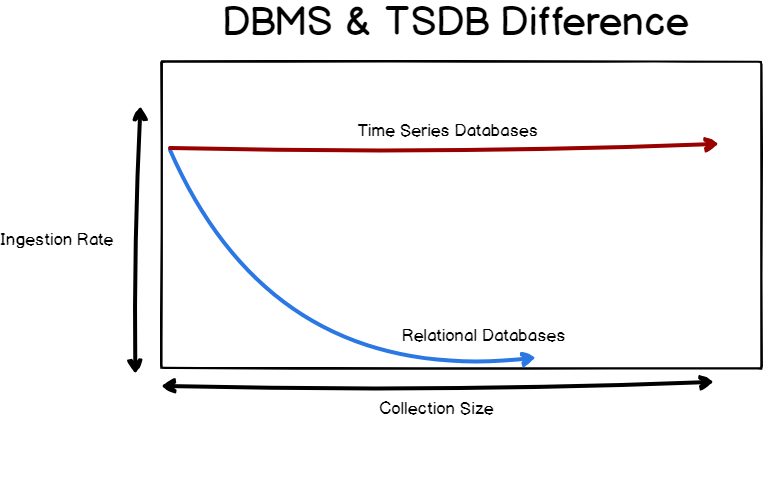
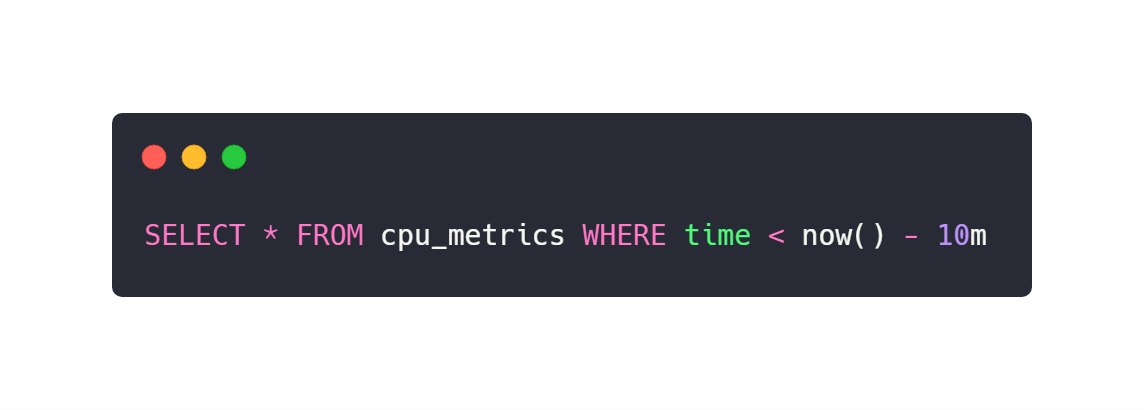
InfluxDB is an open-source time-series database highly optimized for storing time data, like data from sensors inserted in the IoT environment. With this database, the data stored can be monitored and analyzed, and extra parameters like mean, variance, etc., can be calculated automatically.
In this tutorial, we will be going to discuss completely how to install InfluxDB 1.7 and 2.0 on Linux Server in 2021. Not only this, you can also get quick tips on how to upgrade your InfluxDB instance, or how to setup authentication.
If you are using windows OS, then you can go for our previous tutorial on How to Install InfluxDB on Windows
Important Note: As you probably know, InfluxDB is shifting towards the 2.0 version. As a result, both versions (1.7.x and 2.x) can be utilized. This guide has two major chapters: one for the 1.7.x version and another for the 2.x version.
- Installing InfluxDB 1.7.x
- Option 1: Download the InfluxDB archive via the browser
- Option 2: Adding the repositories to your package manager
- b – Start your InfluxDB service
- c – Configure your InfluxDB instance
- d – Test your InfluxDB instance
- Installing InfluxDB 2.0
- a – Download InfluxDB 2.0 archive from the website.
- b – Move the binaries to your $PATH
- c – Create an InfluxDB 2.0 service
- d – Setting up InfluxDB 2.0
- Frequent Use Cases
- a – Updating your InfluxDB instance (from < 1.7.x to 1.7.x)
- b – Migration path from InfluxDB 1.7.x to InfluxDB 2.0
- c – Running Basic Authentication
- Influx 1.7.x
- InfluxDB 2.0
- Going Further
Installing InfluxDB 1.7.x
Before installing it, let’s check The Definitive Guide To InfluxDB In 2021 and also InfluxDays London Recap for gaining extra knowledge about InfluxDB.
Option 1: Download the InfluxDB archive via the browser
The first step to install InfluxDB on your instance is to download the InfluxDB archive file available on InfluxDB website.
With your web browser, head over to https://portal.influxdata.com/downloads/
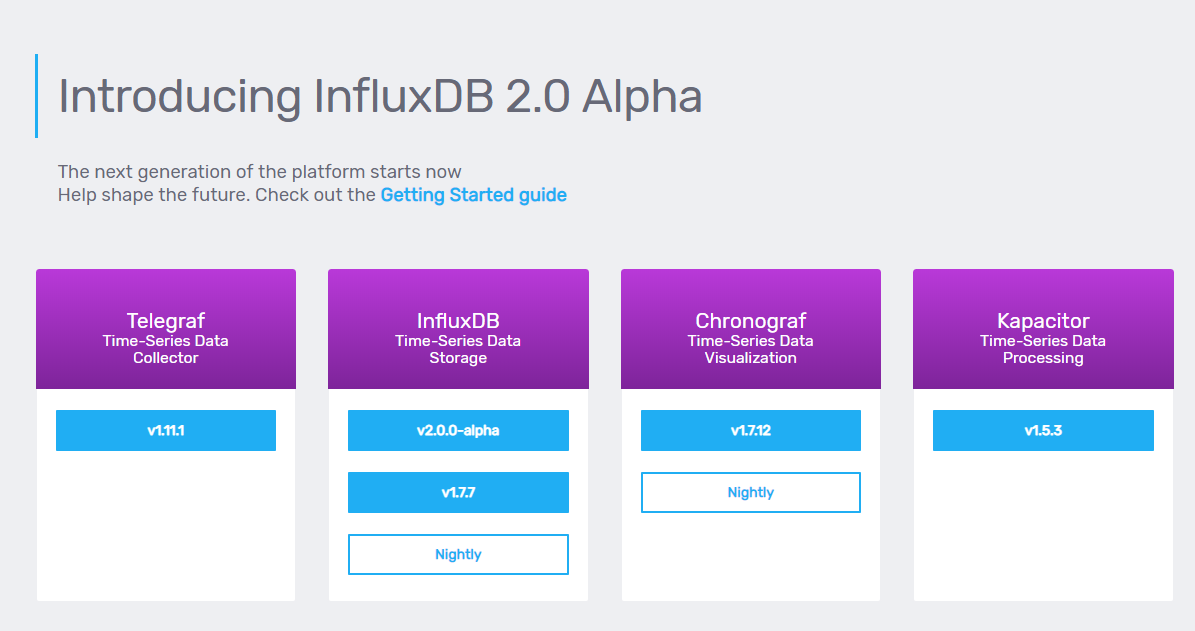
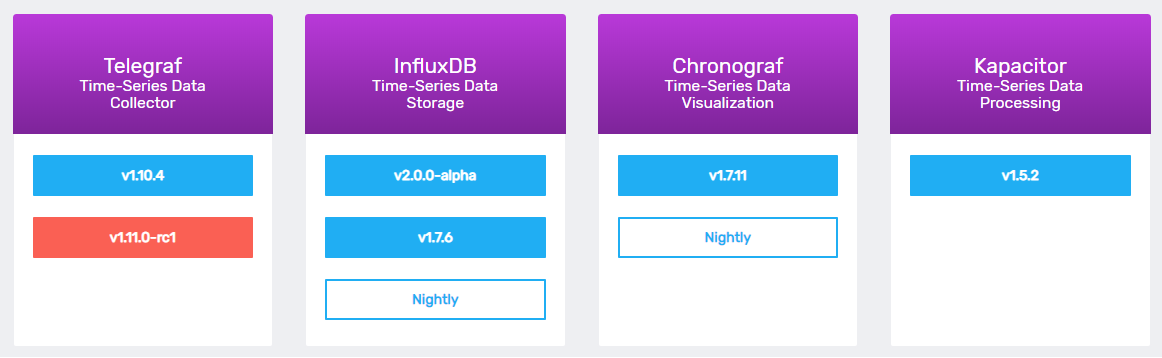
On this page, you should see the four components of the TICK stack :
- Telegraf: a plugin-based agent collector responsible for gathering metrics from stacks and systems;
- InfluxDB: the time series database built by InfluxData;
- Chronograf: a Grafana-like visualization tool designed for InfluxDB and data exploration with Flux;
- Kapacitor: a real-time data processing engine made for manipulating time series data.
Click on the v1.7.7 blue-button available for InfluxDB (this may of course differ in the version changes in the future)
- How To Install InfluxDB on Windows in 2021 | Installation, Configuration & Running of InfluxDB on Windows
- How To Install InfluxDB Telegraf and Grafana on Docker
- The Definitive Guide To InfluxDB In 2021 | InfluxDB Open Source Time Series Database
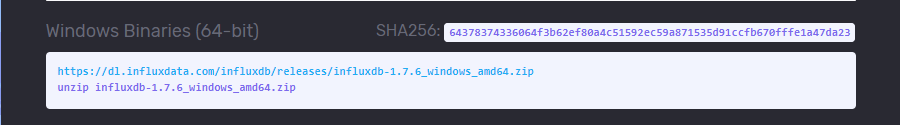
You should see a modal window showcasing all the commands for all the operating systems.
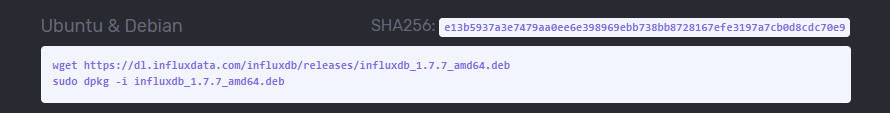
In a terminal, paste the two commands, and hit enter.
$ wget https://dl.influxdata.com/influxdb/releases/influxdb_ 1.7.7_amd64.deb
$ sudo dpkg -i influxdb_1.7.7_amd64.deb
Option 2: Adding the repositories to your package manager
If you are more into installing tools by adding repositories to your Linux apt-get package manager, execute the following commands:
- To install InfluxDB on an Ubuntu machine:
$ curl -sL https://repos.influxdata.com/influxdb.key | sudo apt-key add -
$ source /etc/lsb-release
$ echo "deb https://repos.influxdata.com/${DISTRIB_ID,,} ${DISTRIB_CODENAME} stable" | sudo tee /etc/apt/sources.list.d/influxdb.list
- To Install InfluxDB on a Debian machine:
$ curl -sL https://repos.influxdata.com/influxdb.key | sudo apt-key add -
$ source /etc/os-release
$ test $VERSION_ID = "7" && echo "deb https://repos.influxdata.com/debian wheezy stable" | sudo tee /etc/apt/sources.list.d/influxdb.list
$ test $VERSION_ID = "8" && echo "deb https://repos.influxdata.com/debian jessie stable" | sudo tee /etc/apt/sources.list.d/influxdb.list
$ test $VERSION_ID = "9" && echo "deb https://repos.influxdata.com/debian stretch stable" | sudo tee /etc/apt/sources.list.d/influxdb.list
b – Start your InfluxDB service
If the dpkg command was successful, InfluxDB should be set as a service on your system.
$ sudo systemctl start influxdb.service
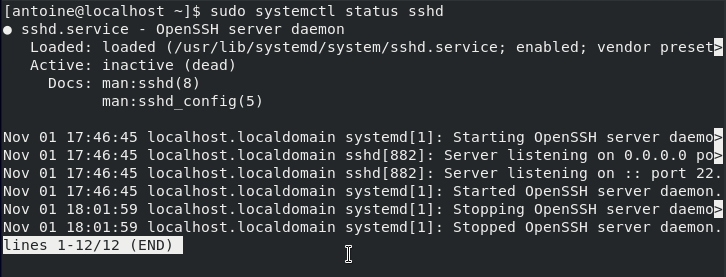
$ sudo systemctl status influxdb.service
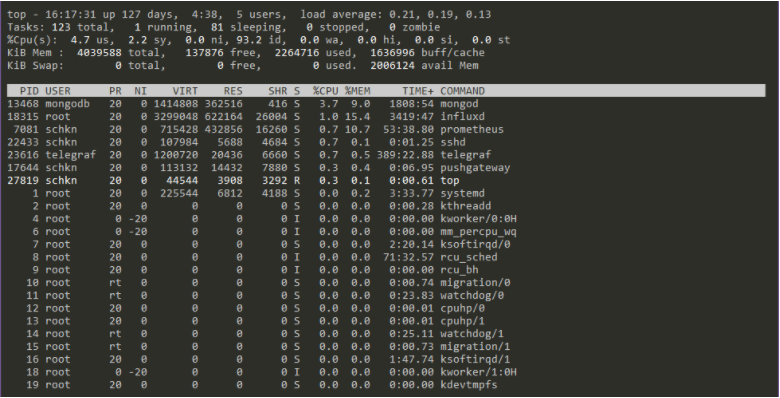
schkn@schkn-ubuntu:~/softs/influxdb$ sudo systemctl status influxdb.service
● influxdb.service - InfluxDB is an open-source, distributed, time series database
Loaded: loaded (/lib/systemd/system/influxdb.service; enabled; vendor preset: enabled)
Active: active (running) since Sat 2019-01-12 19:00:53 UTC; 5 months 18 days ago
Docs: https://docs.influxdata.com/influxdb/
Main PID: 18315 (influxd)
Tasks: 21 (limit: 4704)
CGroup: /system.slice/influxdb.service
└─18315 /usr/bin/influxd -config /etc/influxdb/influxdb.conf
Note: If you are not using systemd, you have to launch the service the old way.
$ sudo service influxdb start
As you can see from the systemd definition file:
- The influxd binary is located at /usr/bin/influxd
- The configuration file is located at /etc/influxdb/influxdb.conf
- Your systemd service file is located at /lib/systemd/system/influxdb.service
- Paths defined above can be configured via the /etc/default/influxdb file.
Here’s the content of your InfluxDB systemd file.
[Unit]
Description=InfluxDB is an open-source, distributed, time series database
Documentation=https://docs.influxdata.com/influxdb/
After=network-online.target

[Service]
User=influxdb
Group=influxdb
LimitNOFILE=65536
EnvironmentFile=-/etc/default/influxdb
ExecStart=/usr/bin/influxd -config /etc/influxdb/influxdb.conf $INFLUXD_OPTS
KillMode=control-group
Restart=on-failure

[Install]
WantedBy=multi-user.target
Alias=influxd.service
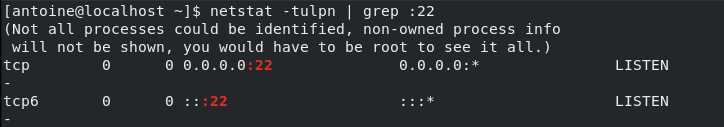
By default, InfluxDB runs on port 8086.
c – Configure your InfluxDB instance
As a reminder, the configuration file is located at /etc/influxdb/influxdb.conf.
First, we are going to make sure that the HTTP endpoint is correctly enabled.
Head over to the [http], and verify the enabled parameter.
[http]
  # Determines whether HTTP endpoint is enabled.
  enabled = true

  # Determines whether the Flux query endpoint is enabled.
  flux-enabled = true

  # The bind address used by the HTTP service.
  bind-address = ":8086"
Optional : you can enable HTTP request logging by modifying the log-enabled parameter in the configuration file.
# Determines whether HTTP request logging is enabled.
log-enabled = true
d – Test your InfluxDB instance
In order to test your InfluxDB instance, first launch the CLI by submitting the “influx” command.
schkn@schkn-ubuntu:/etc/influxdb$ influx
Connected to http://localhost:8086 version 1.7.2
InfluxDB shell version: 1.7.7
> show databases
name: databases
name
_internal
To test that your HTTP request endpoint is correctly enabled, launch the following command:
$ schkn@schkn-ubuntu:/etc/influxdb$ curl -G http://localhost:8086/query --data-urlencode "q=SHOW DATABASES"

{"results":[{"statement_id":0,"series":[{"name":"databases","columns":["name"],"values":[["_internal"]]}]}]}
Great!
You now have successfully installed InfluxDB 1.7.x running on your instance.
If you want to secure it with authentication and authorization, there is a bonus section about it at the end.
Installing InfluxDB 2.0
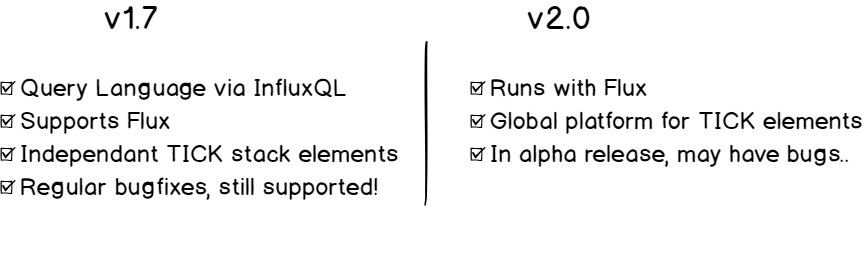
As a quick reminder, InfluxDB is shifting towards version 2.0.
Before, in version 1.7.x, you had four different components that one would assemble to form the TICK stack (Telegraf, InfluxDB, Chronograf and Kapacitor).
In version 2.0, InfluxDB becomes a single platform for querying, visualization and data manipulation.
InfluxDB could be renamed Influx 2.0, as it is not simply a time series database anymore, but a whole platform for your needs.
Here are the complete steps to install InfluxDB 2.0 on your Linux machine.
a – Download InfluxDB 2.0 archive from the website.
Head to the Linux section, and copy the link for your CPU architecture.
The archives for InfluxDB 2.0 are available on this website : https://v2.docs.influxdata.com/v2.0/get-started/
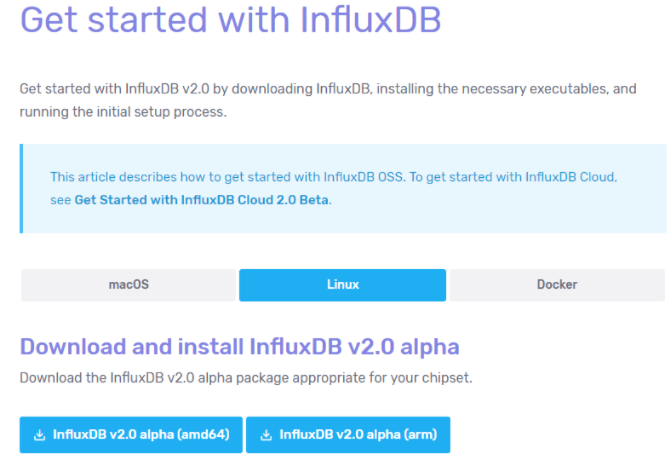
When the link is copied, similarly to what you have done before, download the archive using a wget command.
$ wget https://dl.influxdata.com/influxdb/releases/influxdb _2.0.0-alpha.14_linux_amd64.tar.gz
$ tar xvzf influxdb_2.0.0-alpha.14_linux_amd64.tar.gz
As you probably noticed, InfluxDB 2.0 does not come yet as a service. This is what we are going to do in the next steps.
b – Move the binaries to your $PATH
Later on, we are going to use those binaries in our service file.
As a consequence, we need those files to be stored in a location where we can find them.
$ sudo cp influxdb_2.0.0-alpha.14_linux_amd64/{influx,influxd} /usr/local/bin/
c – Create an InfluxDB 2.0 service
As always, if this is not already the case, create a influxdb user on your machine.
$ sudo useradd -rs /bin/false influxdb
In the /lib/systemd/system folder, create a new influxdb2.service file.
$ sudo vi influxdb2.service
Paste the following configuration inside.
[Unit]
Description=InfluxDB 2.0 service file.
Documentation=https://v2.docs.influxdata.com/v2.0/get-started/
After=network-online.target

[Service]
User=influxdb
Group=influxdb
ExecStart=/usr/local/bin/influxd
Restart=on-failure

[Install]
WantedBy=multi-user.target
You can now start your service.
Make sure that your service is up and running before continuing.
$ sudo systemctl start influxdb2
$ sudo systemctl status influxdb2
● influxdb2.service - InfluxDB 2.0 service file.
   Loaded: loaded (/lib/systemd/system/influxdb2.service; disabled; vendor preset: enabled)
   Active: active (running) since Wed 2019-07-03 21:23:28 UTC; 4s ago
     Docs: https://v2.docs.influxdata.com/v2.0/get-started/
 Main PID: 22371 (influxd)
    Tasks: 10 (limit: 4704)
   CGroup: /system.slice/influxdb2.service
           └─22371 /usr/local/bin/influxd
Awesome! Your InfluxDB 2.0 service is now running.
We are now going to configure the minimal setup for your server.
d – Setting up InfluxDB 2.0
The first step to configure your InfluxDB 2.0 server is to navigate to http://localhost:9999.
You should now see the following screen:
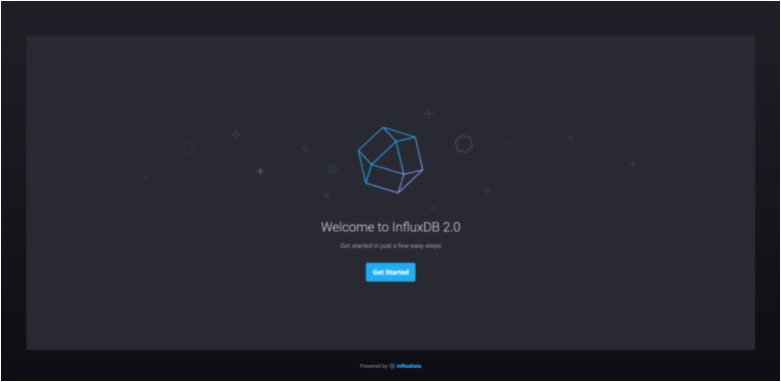
Click on the “Get Started” button.
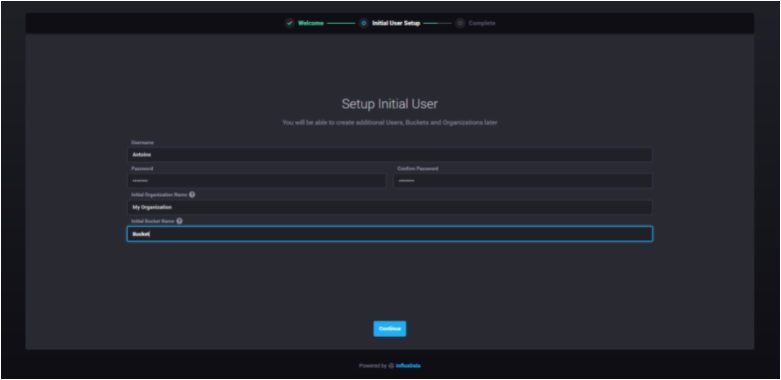
The first thing you are asked to do is to configure your initial user. You are asked to provide :
- Your username;
- Your password;
- Your initial organization name (that can be changed later);
- Your initial bucket name (that also can be changed later)
When you are done, just press “Continue” to move on.
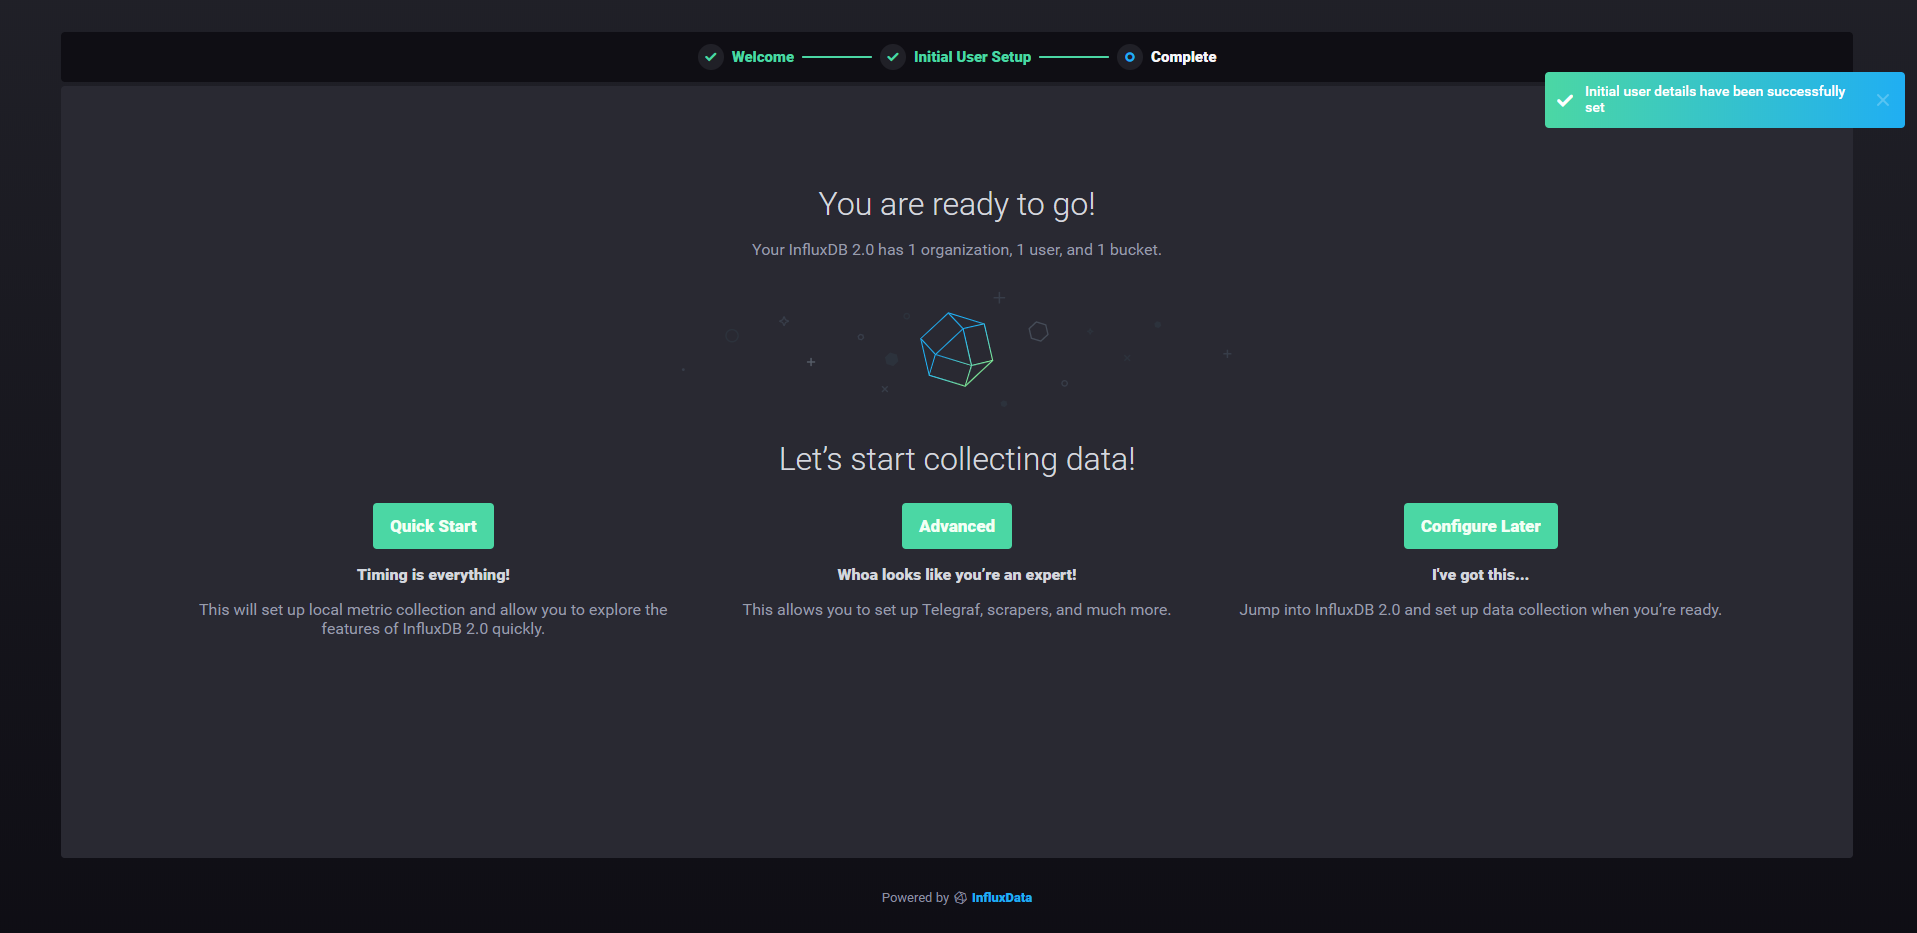
That’s it!
From there, you have multiple options. I like to go for the quick start as it provides a complete step by step tutorial on setting up Telegraf with your InfluxDB instance.
When clicking on “Quick Start“, this is the screen that you are going to see.
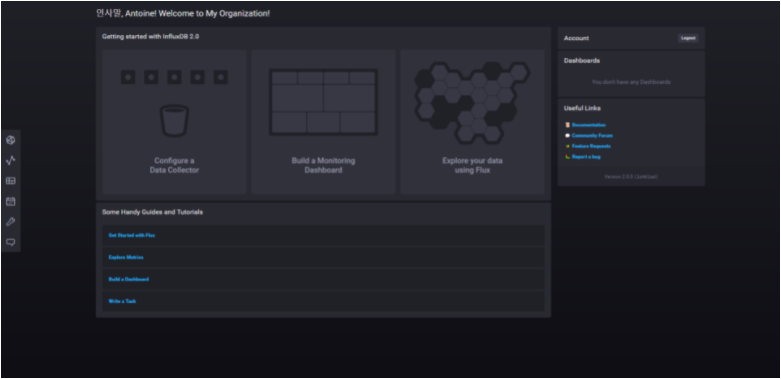
Congratulations! You know have a functional InfluxDB 2.0 instance running on your computer, as a service!
As a bonus section, let’s see a couple of frequent use cases that you may encounter on your InfluxDB journey.
Frequent Use Cases
a – Updating your InfluxDB instance (from < 1.7.x to 1.7.x)
Sometimes you want to upgrade your InfluxDB 1.6.x to 1.7.x.
You can upgrade your version very easily by following the installation instructions describe above. When launching the dpkg command, you’ll be presented with the following options.
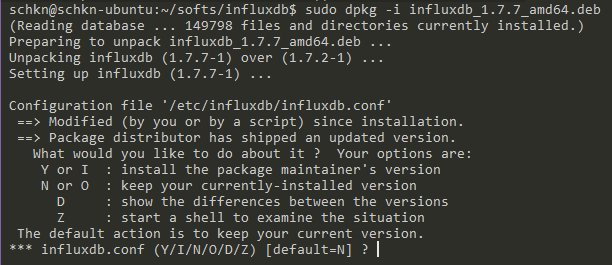
As you can see, the influxdb binary is trying to merge your configuration files, if you have configuration files already existing.
You have multiple choices, you can :
- Erase your current version and use a new one : Y or I
- Keep your installed version: N or O
- Show the differences, pretty much like a git diff : D (recommended)
- Start an interactive shell to check the differences: Z
In order to check the differences, let’s press D, and observe the output.
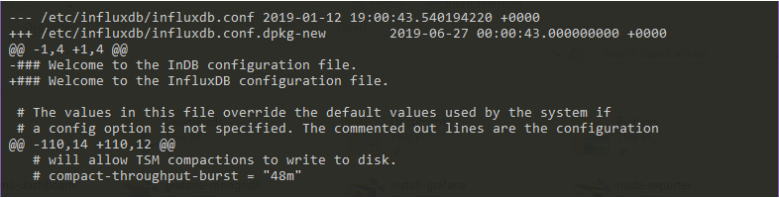
As you can see, you have an output very similar to what you would get in git for example.
When you are done, press ‘q‘ to exit to leave the comparison and to go back to the first multichoice screen.
b – Migration path from InfluxDB 1.7.x to InfluxDB 2.0
The complete migration is not yet available as of July 2021. This is one of the remaining points in order for InfluxDB 2.0 not to be in alpha version anymore.
As soon as more details are available on the subject, I will make to keep this section updated.
c – Running Basic Authentication
Influx 1.7.x
Now that you have installed your InfluxDB instance, you want to make sure that requests and accesses are authenticated when interacting with InfluxDB.
First, create an administrator account for your InfluxDB database.
$ influx
Connected to http://localhost:8086 version 1.7.7
InfluxDB shell version: 1.7.7
> CREATE USER admin WITH PASSWORD 'admin123' WITH ALL PRIVILEGES
> SHOW USERS
user  admin
----  -----
admin true
Now that you have an administrator account, enable the http authentication for your database.
$ sudo vi /etc/influxdb/influxdb.conf

[http]
  # Determines whether HTTP endpoint is enabled.
  enabled = true

  # Determines whether the Flux query endpoint is enabled.
  flux-enabled = true

  # The bind address used by the HTTP service.
  bind-address = ":8086"

  # Determines whether user authentication is enabled over HTTP/HTTPS.
  auth-enabled = true
Exit your file, and restart your service.
$ sudo systemctl restart influxdb
Now, try to run the unauthenticated request that we run during the installation process.
$ curl -G http://localhost:8086/query --data-urlencode "q=SHOW DATABASES"
{"error":"unable to parse authentication credentials"}
Great!
The authentication is working. Now add some authentication parameters to your curl request.
$ curl -G http://localhost:8086/query -u admin:admin123 --data- urlencode "q=SHOW DATABASES"
{"results":[{"statement_id":0,"series":[{"name":"databases","columns":["name"],"values":[["_internal"]]}]}]}
InfluxDB 2.0
To end this tutorial, let’s see how we can setup a basic authentication layer for InfluxDB 2.0.
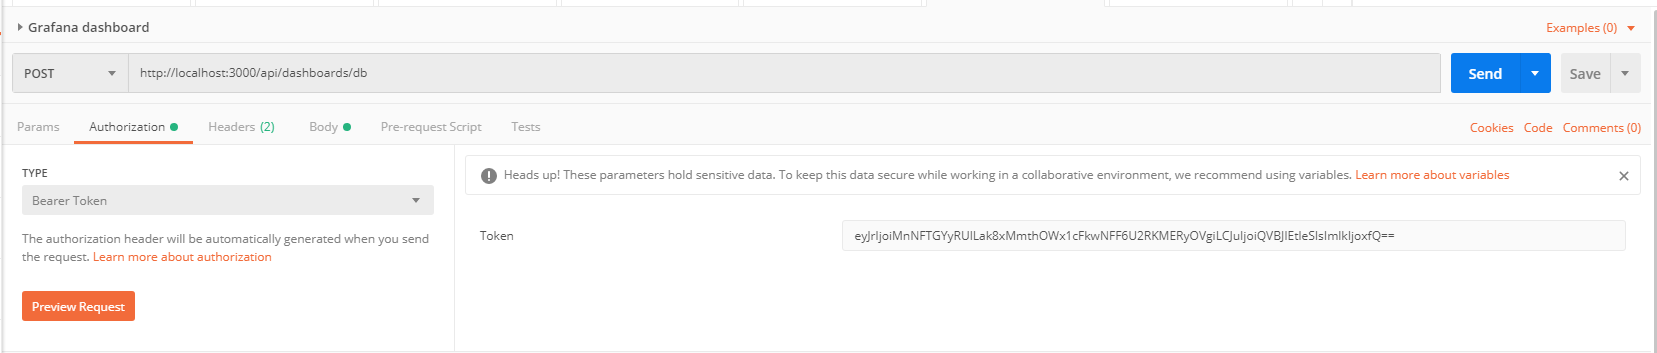
There are two ways to perform it: using the Web UI, or using the CLI.
I am going to use the Web UI for this tutorial.
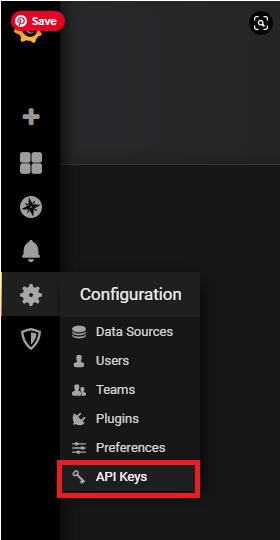
In the left menu, click on Settings, and navigate to the Tokens submenu.
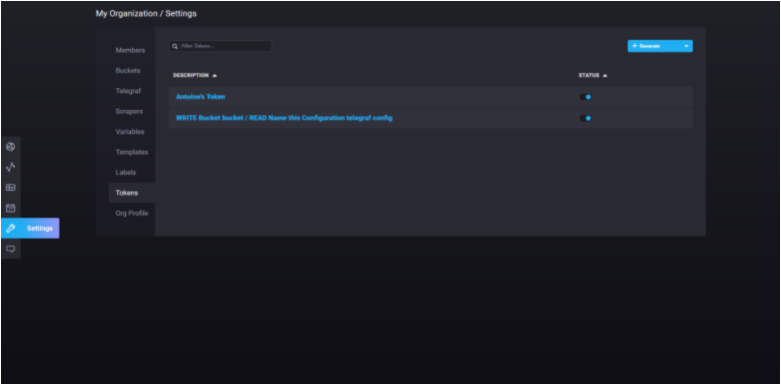
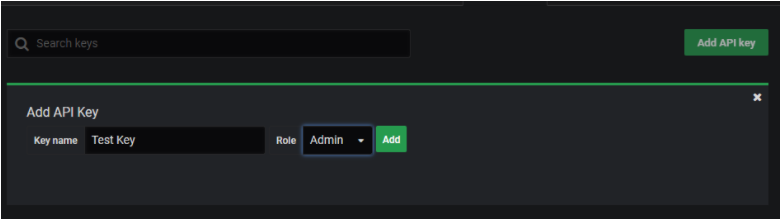
In order to generate a new token, click on the “generate” button at the top-right side of the UI.
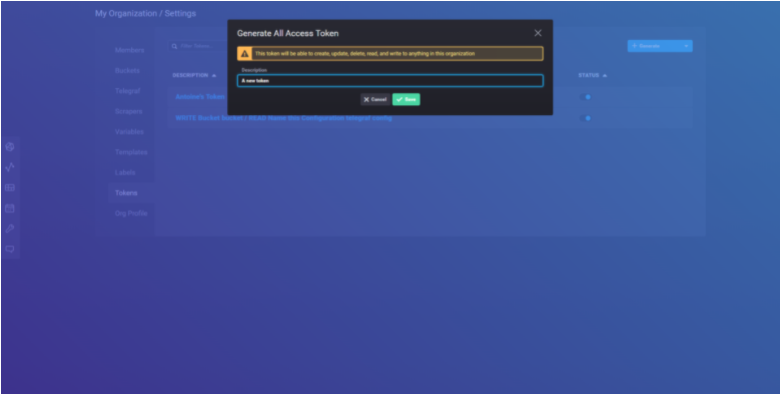
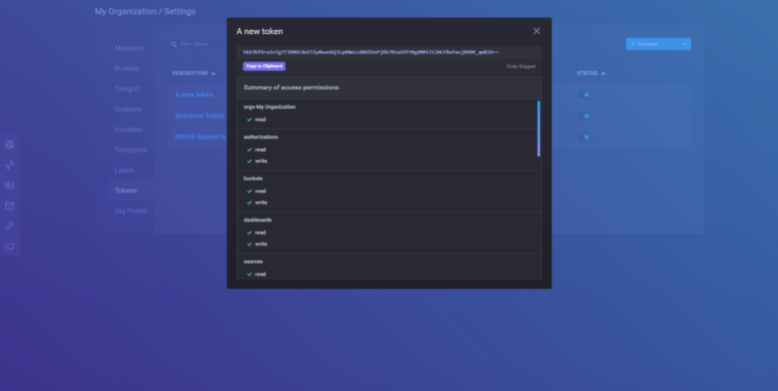
Set a new description for your token, and click on save. Later, your new token should now appear on the list.
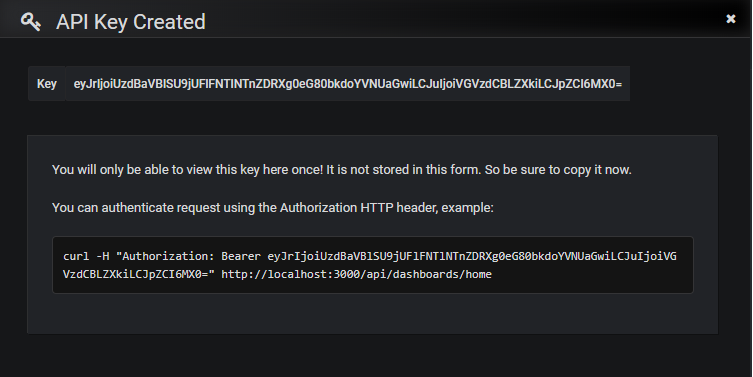
Click on the new entry to get your token.
Going Further
If you want a complete guide on learning InfluxDB from scratch, here is a complete guide for InfluxDB.
If you are on a Windows computer, you can learn how to monitor your windows services with the ultimate tutorials provided on Junosnotes.com
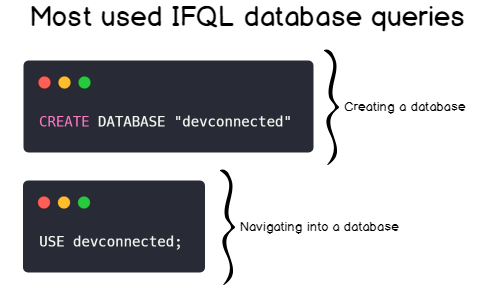
Finally, here’s a tutorial to learn How To Create a Database on InfluxDB 1.7 & 2.0