In this digital world, every small and big organization is coming up with their best services in a website form for a good reach into the audience. The rise of their volume and value of the data growing very frequently. Are you a bit worried to get more value out of your data? Not anymore, switch to the dashboard technique where it serves as an important tool to monitor and control the situation within an organization.
While storing data in a time-series database, usually, you need to visualize and analyze it to have a more precise idea of trends, seasonalities, or unexpected changes that may be anomalies. This is when the open-source dashboard monitoring tools come into play.
In this tutorial, we are going to concentrate mainly on the 4 best open source dashboard monitoring tools in 2021 along with what is dashboard & dashboard software with their key aspects. However, we will also discuss what their qualities are, the industries they are linked to, and how they vary from each other.
- What is Dashboard?
- What is Dashboard Software?
- Types of Dashboard
- How to find the perfect Dashboard?
- Key Aspects of Dashboard Software
- What is an Open Source Dashboard Monitoring Tool?
- Advantages of Dashboard Management Software
- Best Free Open Source Dashboard Monitoring Tools in 2021
What is Dashboard?
A dashboard is a tool that performs all administration KPIs (key performance indicators) and crucial data points at a particular place that assists in monitoring the strength of the business or department. The dashboard analyzes the complex data sets by making use of data visualization, which in turn supports users to gain knowledge of the current performance at a glance. The user can visualize data in the form of charts, graphs, or maps.
- How To Create a Grafana Dashboard? (UI + API methods) | Best Practices for Creating Dashboard
- Complete Node Exporter Mastery with Prometheus | Monitoring Linux Host Metrics WITH THE NODE EXPORTER
- Monitoring Linux Processes using Prometheus and Grafana | Prometheus & Grafana Linux Monitoring
What is Dashboard Software?
Dashboard software serves as an automated tool that analyzes complex data sets and assists in revealing the patterns of data processing. With the help of dashboard management software, users can easily access, interact, and analyze up-to-date information at a centralized location. The usage of this technology is very huge, you can utilize it in different business processes like marketing, human resource, sales, and production. Mainly, it helps business people to monitor their business performance at a glance.
Also Check: 6 Tips To A Successful Code Review
Types of Dashboard
Present in the market, you can discover different dashboard types that are depending on where they are utilized like for large enterprises or for small-scale industries. The types of the dashboard are as follows:
- Tactical Dashboards: Managers who need a deeper knowledge of a company’s actions make use of it.
- Operational Dashboards: It is applied in sales, finances, services, manufacturing, and human resources.
- Strategic Dashboards: Senior executive uses this type to monitor the progress of the company striving to reach strategic goals.
How to find the perfect Dashboard?
By following these tips, we can easily discover the perfect dashboard for your firm or business:
- Ease of Use
- Customization
- Scalability
- Integration
- Extendable
- Modularity
- Security Management
- Exporting Options
Key Aspects of Dashboard Software
Remember that your dashboard software tool should include all required features for your business so that you can obtain the most out of your data:
- Global Dashboard Filters
- Dynamic Images
- Multiple Sharing Options
- Embedded Analytics
- Dashboard tabs
- Visual Representations
- 24/7 Dashboard Access
- Predefined Dashboard Templates
- Printing Bounds
- Public Links
What is an Open Source Dashboard Monitoring Tool?
Open source dashboard monitoring tools are designed to provide powerful visualizations to a wide variety of data sources. Often linked with time-series databases, they can also be linked with regular relational databases.
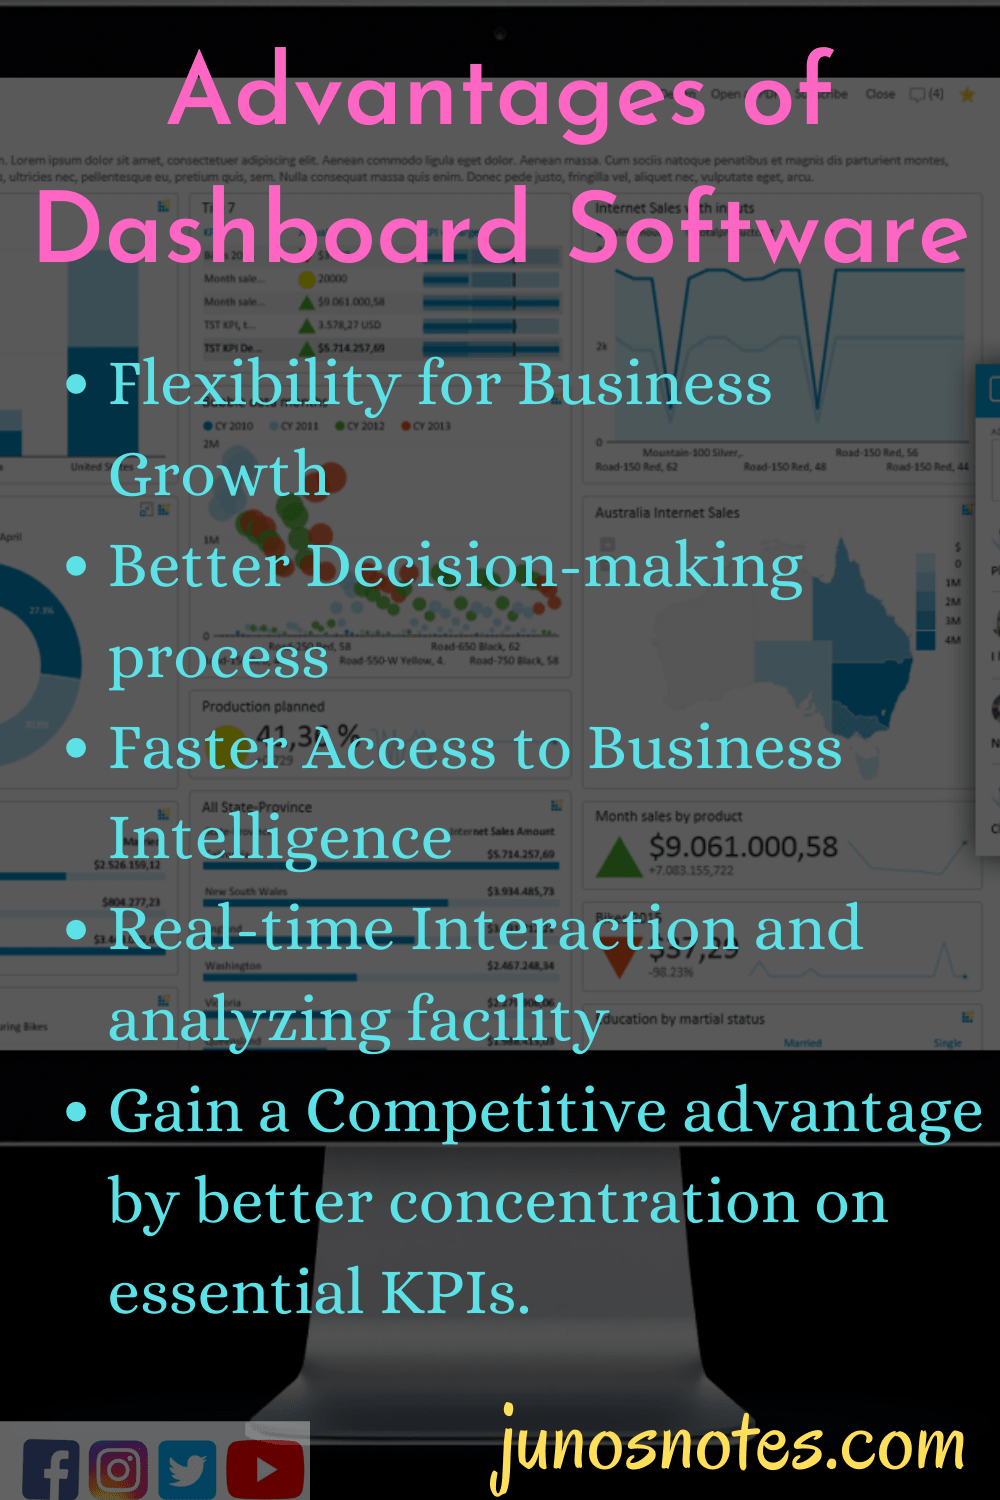
Advantages of Dashboard Management Software
The benefits of Dashboard Management Software are provided in the following shareable image:
Best Free Open Source Dashboard Monitoring Tools in 2021
The following four main free and open-source dashboard software tools provide high-quality options free of cost.
Check out the advantages, limitations, uses, and many more about them from the below modules:
1. Grafana
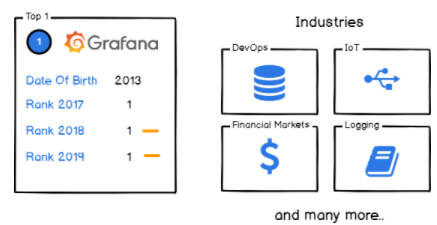
Grafana is by far one of the most popular dashboard monitoring systems in use.
Released in 2013 and developed by Grafana Labs, Grafana plugs into a wide variety of data sources and provides a ton of panels to visualize your data.
One of the most common usages of Grafana is plugging into time series databases in order to visualize data in real-time. For certain panels, Grafana is equipped with an alerting system that allows users to build custom alerts when certain events occur on your data.
Gauges, world maps, tables, and even heatmaps are concrete examples of panels that you are going to find in Grafana.
New panels are released very frequently: as we write this article, Grafana just announced v6.2 which is shipping the brand new bar gauge panel.
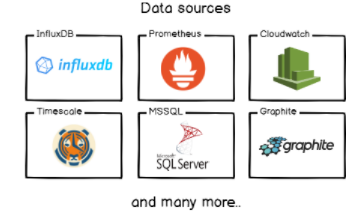
As described previously, Grafana plugs to many different data sources: InfluxDB or Prometheus are examples of time series databases available; for relational databases, you can easily plug to MySQL or PostgreSQL databases (or TimescaleDB). Indexes are also available via the ElasticSearch connector.
In my opinion, Grafana remains a reference for open-source dashboard monitoring. Their latest additions (such as the ‘Explore’ function or the new panels) emphasize their ambition to bring a global tool for monitoring, alerting, and analyzing data.
For curious developers, you can check Torkel Ödegaard’s great talk at GrafanaCon 2019 where he described Grafana’s roadmap and future projects.
2. Chronograf
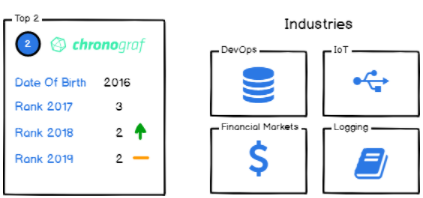
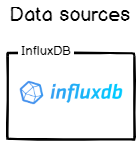
Developed by InfluxData for many years, Chronograf is a solid alternative to Grafana when it comes to visualizing and exploring your data for InfluxDB data sources.
Chronograf exposes similar panels but there is one major difference with Grafana: Chronograf really focuses on exploring, querying, and visualizing data using InfluxQL and the Flux language. If you’re not familiar with what the Flux language is, you can check the article that I wrote that unveils the different capabilities of this new programming language.
So should you use Grafana or Chronograf?
In the end, it all comes down to your needs.
If you’re dealing a lot with InfluxDB in your infrastructure, then you should use Chronograf as it is specifically designed to handle InfluxDB databases.
On the other hand, if you have a variety of data sources, you should use Grafana. Those tools have similar abilities but Chronograf is more Influx-centered than Grafana.
As Tim Hall mentioned in his “Chronograf – Present & Future” talk in InfluxDays 2018: the answer is to try both!
The UI aspect of Chronograf is very decent and modern: I think that you should try it at least once if you’re dealing with InfluxDB databases.
Would you link to see what a Chronograf dashboard look like? Head over to my ‘Monitoring systemd services in real-time using Chronograf‘ article!
3. Netdata
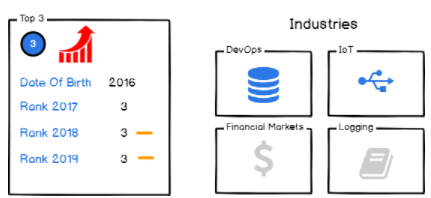
Netdata is a tool that tracks performance and monitors health for a wide panel of systems and applications.
Netdata is configuration-based and runs as a daemon on the target machine.
Furthermore, Netdata is plugin-based.
When defining your daemon, you can choose from a panel of plugins that are either internal or external.
When you are set, there are two ways for you to retrieve and visualize data:
- “Pull” method: you can set Netdata to run on individual nodes and plug your dashboards directly into it. This way, you can scale your node to your needs and you are not concerned about the scaling of different nodes. Also, storage is scoped to what’s really needed by a particular node thus more efficient;
- “Push” method: Similar to what you would find in Prometheus with Pushgateway, you can ‘push’ metrics to a centralized place. You may find this handy for jobs that have a small lifespan such as batch jobs.
With Netdata, you can easily configure streaming pipelines for your data and replication databases.
This way, you can scale slave nodes depending on your needs and adapt to the actual demand.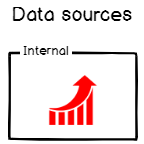
Netdata’s website is available here: https://my-netdata.io/
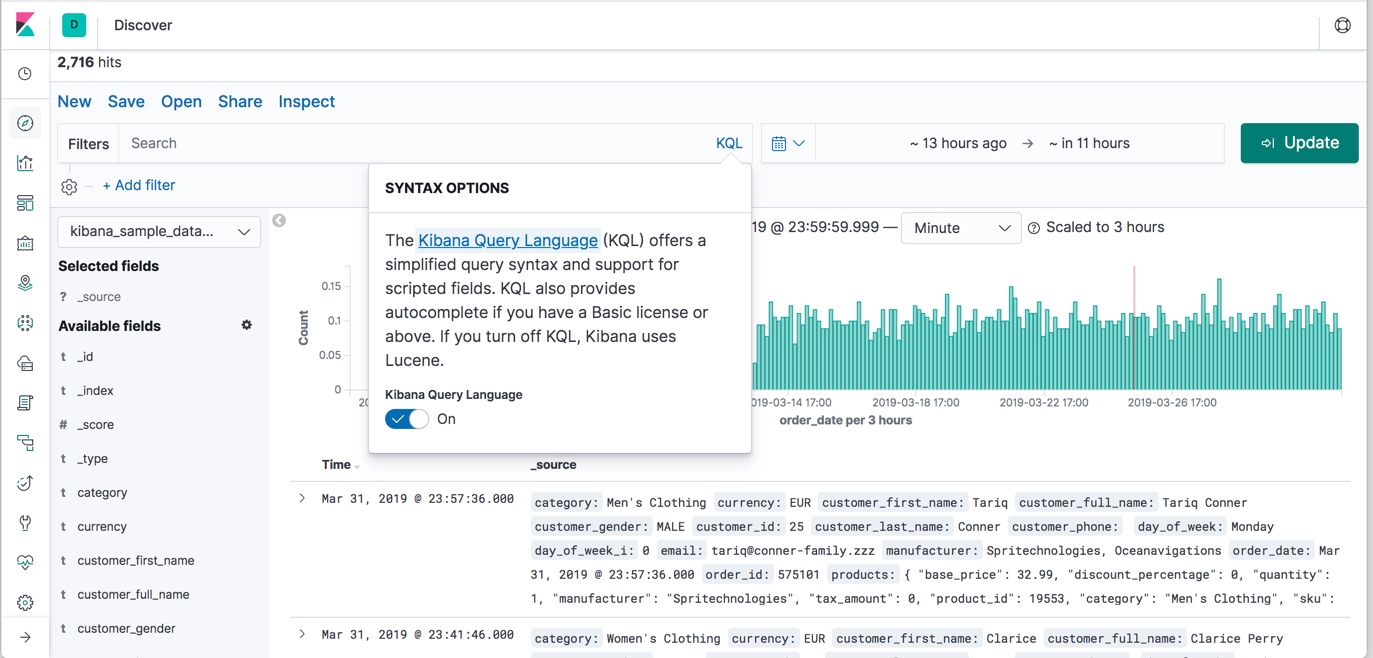
4. Kibana
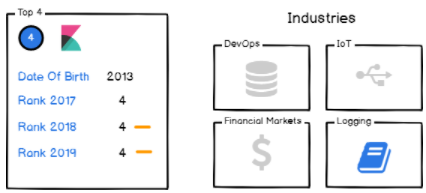
Any dashboard monitoring ranking wouldn’t be complete without mentioning Kibana.
Kibana is part of Elastic’s product suite and is often used in what we call an ELK stack: ElasticSearch + Logstash + Kibana.
You probably know ElasticSearch, the search engine based on the Lucene language.
If you’re unfamiliar with Elastic products, ElasticSearch provides a REST-based search engine that makes it fast and easy to retrieve data. It is often used in companies that are looking to speed up their data retrieval processes by providing fast interfaces to their end-users.
Logstash can be defined as a log pipeline. Similar to rsyslog, you can bind it to an extensive list of data sources (AWS, databases, or stream pipelines such as Kafka). Logstash will collect, transform data and insert it into ElasticSearch. Finally, Kibana will be used to visualize data stored in ElasticSearch.
As you guessed it, Kibana is suited for log monitoring and has nothing to do with the direct network or DevOps monitoring (even if you could store logs related to servers or virtual machines!)
Wrapping Up
After referring to the above data, you get an idea of the best free and open-source dashboard monitoring tools. Now, it’s time for applying them to your company’s tech stack. Check out and analyze how do you plan on adding them to your company tech stack?
Well, are you utilizing them already? please let us know what were you able to accomplish with them? How did they specifically add value to your business?
Thank you for reading this article, I hope that you found it insightful. Until then, have fun, as always, and also visit our site for better knowledge on various technologies.