Guys who hold Linux systems & who work as system administrators can get a high opportunity to work with Syslog, at least one time.
When you are working to system logging on Linux system then it is pretty much connected to the Syslog protocol. It is a specification that defines a standard for message logging on any system.
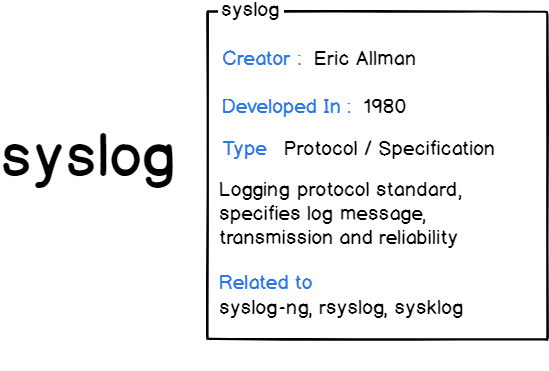
Developers or administrators who are not familiar with Syslog can acquire complete knowledge from this tutorial. Syslog was designed in the early ’80s by Eric Allman (from Berkeley University), and it works on any operating system that implements the Syslog protocol.
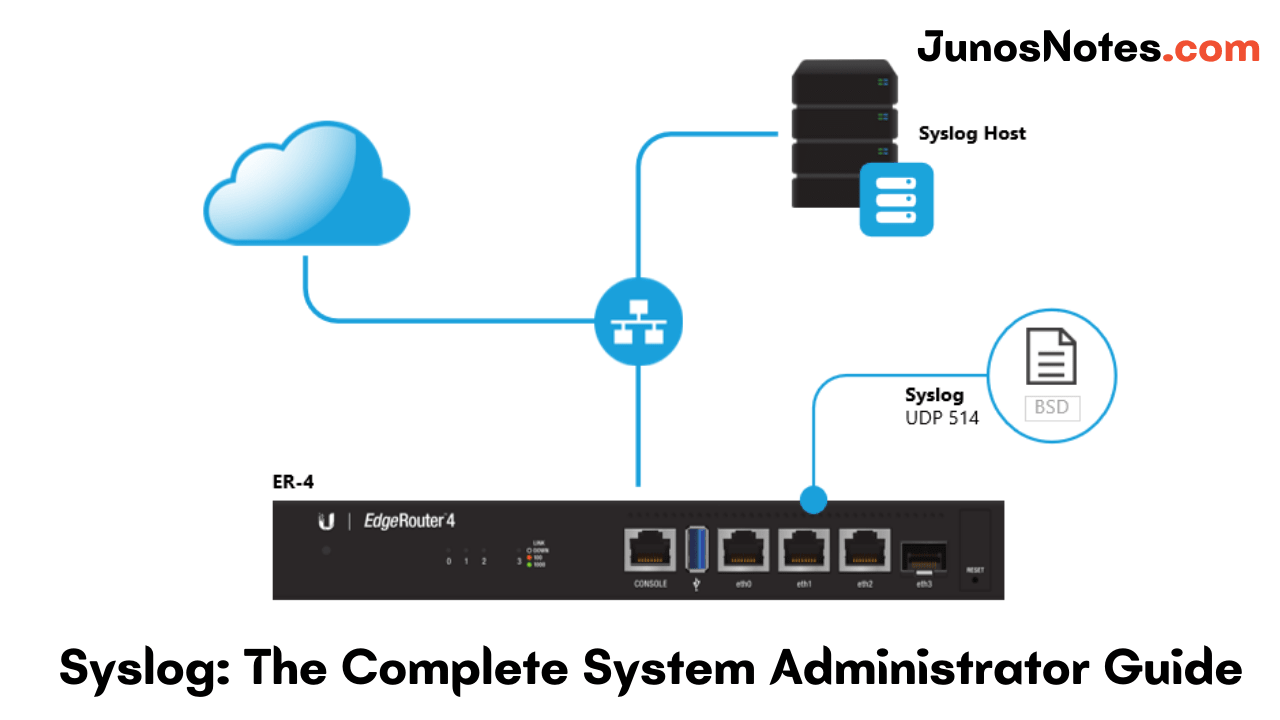
The perfect destination that you should come to learn more about Syslog and Linux logging, in general, is this Syslog: The Complete System Administrator Guide and other related articles on Junosnotes.com
Here is everything that you need to know about Syslog:
- What is the purpose of Syslog?
- What is Syslog architecture?
- How Syslog Architecture Works?
- The Syslog Format
- What is the Syslog message format?
- How does Syslog message delivery work?
- What are current Syslog implementations?
- Best Practices of the Syslog
What is the purpose of Syslog?
Syslog is used as a standard to produce, forward, and collect logs produced on a Linux instance. Syslog defines severity levels as well as facility levels helping users having a greater understanding of logs produced on their computers. Logs can, later on, be analyzed and visualized on servers referred to as Syslog servers.
- Linux Logging Complete Guide
- The Definitive Guide to Centralized Logging with Syslog on Linux
- How To Install Logstash on Ubuntu 18.04 and Debian 9 | Tutorial on Logstash Configuration
Here are a few more reasons why the Syslog protocol was designed in the first place:
- Defining an architecture: this will be explained in detail later on, but if Syslog is a protocol, it will probably be part of complete network architecture, with multiple clients and servers. As a consequence, we need to define roles, in short: are you going to receive, produce or relay data?
- Message format: Syslog defines the way messages are formatted. This obviously needs to be standardized as logs are often parsed and stored into different storage engines. As a consequence, we need to define what a Syslog client would be able to produce, and what a Syslog server would be able to receive;
- Specifying reliability: Syslog needs to define how it handles messages that can not be delivered. As part of the TCP/IP stack, Syslog will obviously be opinionated on the underlying network protocol (TCP or UDP) to choose from;
- Dealing with authentication or message authenticity: Syslog needs a reliable way to ensure that clients and servers are talking in a secure way and that messages received are not altered.
Now that we know why Syslog is specified in the first place, let’s see how a Syslog architecture works.
Must Refer: How To Install and Configure Debian 10 Buster with GNOME
What is Syslog architecture?
When designing a logging architecture, as a centralized logging server, it is very likely that multiple instances will work together.
Some will generate log messages, and they will be called “devices” or “syslog clients“.
Some will simply forward the messages received, they will be called “relays“.
Finally, there are some instances where you are going to receive and store log data, those are called “collectors” or “syslog servers”.
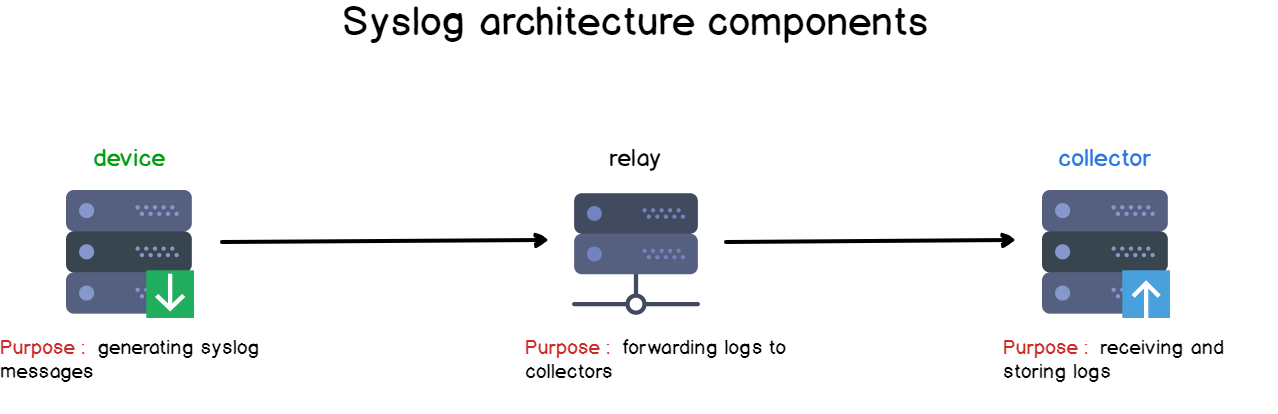
Knowing those concepts, we can already state that a standalone Linux machine acts as a “syslog client-server” on its own: it produces log data, it is collected by rsyslog and stored right into the filesystem.
Here’s a set of architecture examples around this principle.
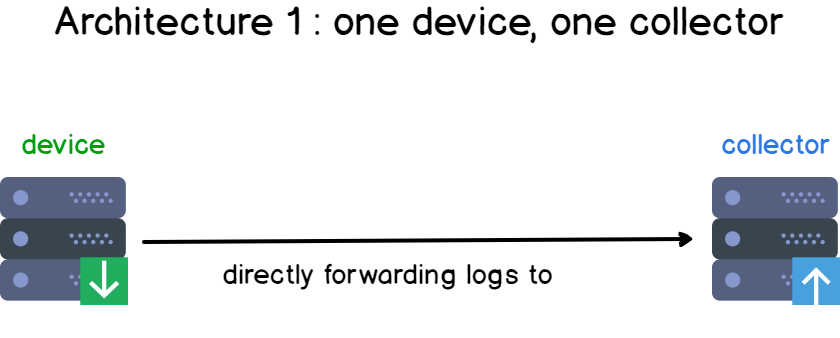
In the first design, you have one device and one collector. This is the most simple form of logging architecture out there.
Add a few more clients to your infrastructure, and you have the basis of a centralized logging architecture.
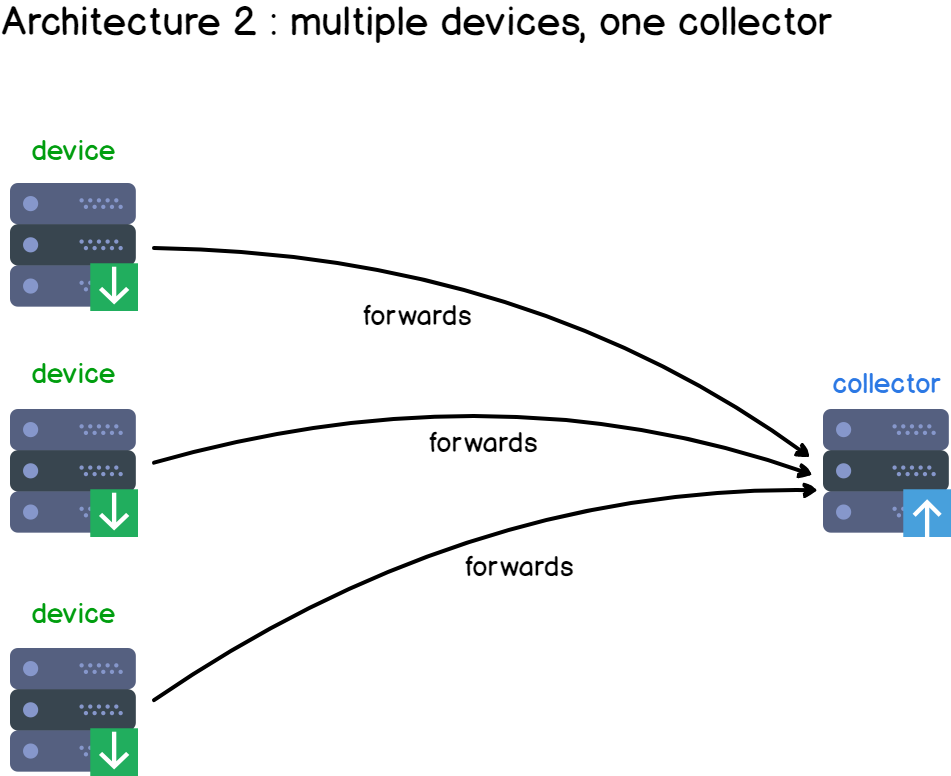
Multiple clients are producing data and are sending it to a centralized syslog server, responsible for aggregating and storing client data.
If we were to complexify our architecture, we can add a “relay“.
Examples of relays could be Logstash instances for example, but they also could be rsyslog rules on the client-side.
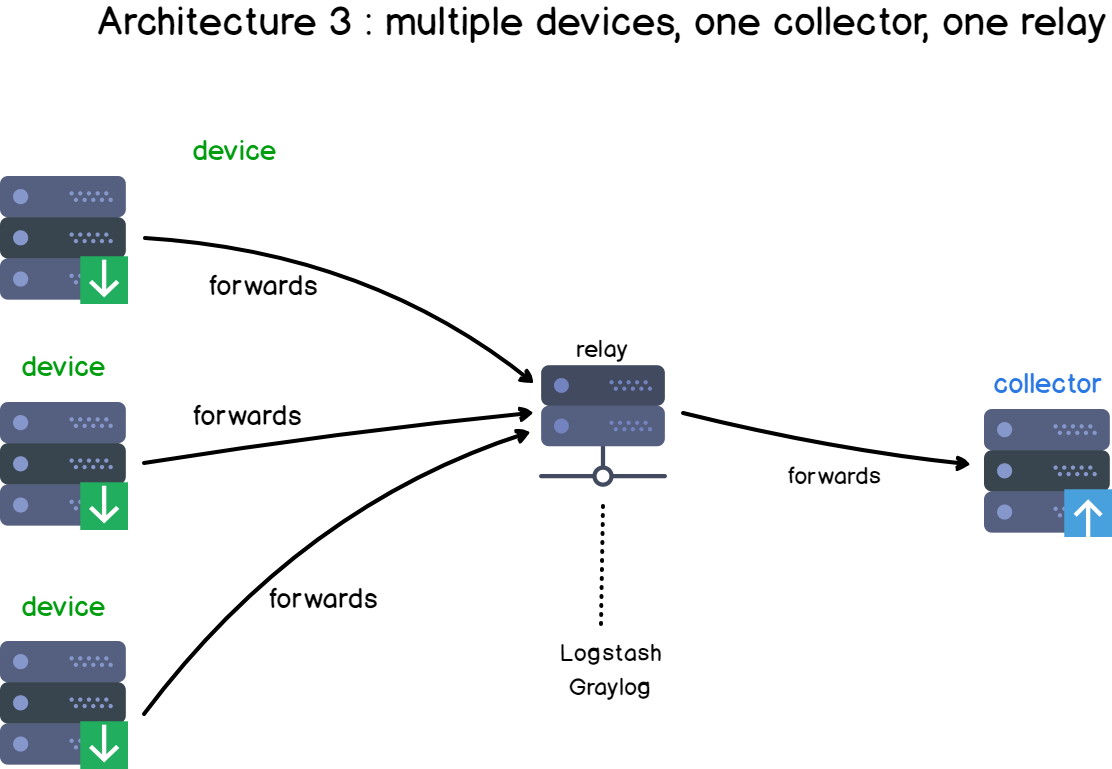
Those relays act most of the time as “content-based routers” (if you are not familiar with content-based routers, here is a link to understand them).
It means that based on the log content, data will be redirected to different places. Data can also be completely discarded if you are not interested in it.
Now that we have detailed Syslog components, let’s see what a Syslog message looks like.
How Syslog Architecture Works?
There are three different layers within the Syslog standard. They are as follows:
- Syslog content (information contained in an event message)
- Syslog application (generates, interprets, routes, and stores messages)
- Syslog transport (transmits the messages)
Moreover, applications can be configured to send messages to different destinations. There are also alarms that give instant notifications for events like as follows:
- Hardware errors
- Application failures
- Lost contact
- Mis-configuration
Besides, alarms can be set up to send notifications through SMS, pop-up messages, email, HTTP, and more. As the process is automated, the IT team will receive instant notifications if there is an unexpected breakdown of any of the devices.
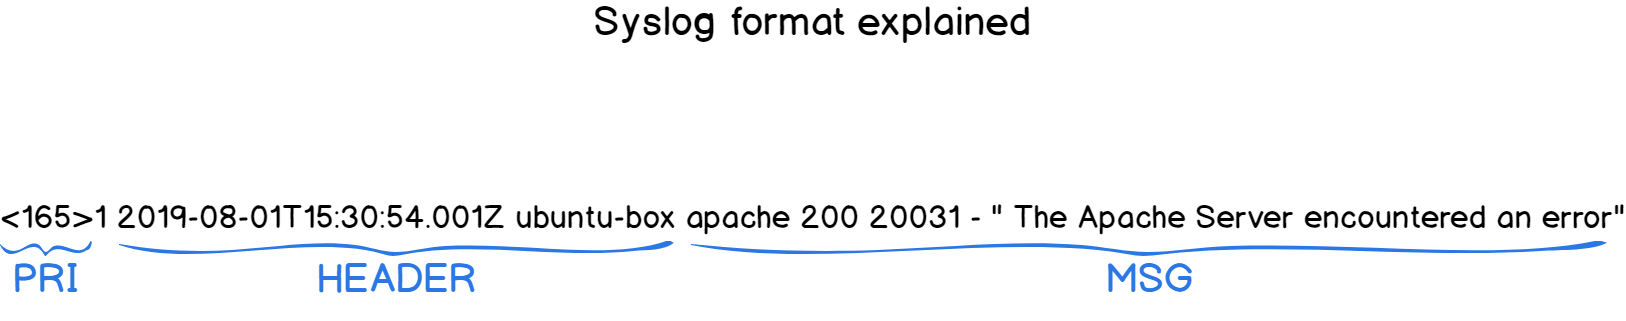
The Syslog Format
Syslog has a standard definition and format of the log message defined by RFC 5424. As a result, it is composed of a header, structured-data (SD), and a message. Inside the header, you will see a description of the type such as:
- Priority
- Version
- Timestamp
- Hostname
- Application
- Process ID
- Message ID
Later, you will recognize structured data which have data blocks in the “key=value” format in square brackets. After the SD, you can discover the detailed log message, which is encoded in UTF-8.
For instance, look at the below message:
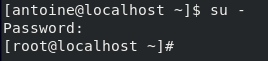
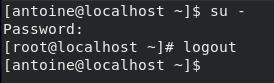
<34>1 2003-10-11T22:14:15.003Z mymachine.example.com su - ID47 - BOM'su root' failed for lonvick on /dev/pts/8
Writes to the resulting format:
<priority>VERSION ISOTIMESTAMP HOSTNAME APPLICATION PID MESSAGEID STRUCTURED-DATA MSG
What is the Syslog message format?
The Syslog format is divided into three parts:
- PRI part: that details the message priority levels (from a debug message to an emergency) as well as the facility levels (mail, auth, kernel);
- HEADER part: composed of two fields which are the TIMESTAMP and the HOSTNAME, the hostname being the machine name that sends the log;
- MSG part: this part contains the actual information about the event that happened. It is also divided into a TAG and a CONTENT field.
Before detailing the different parts of the syslog format, let’s have a quick look at syslog severity levels as well as syslog facility levels.
a – What are Syslog facility levels?
In short, a facility level is used to determine the program or part of the system that produced the logs.
By default, some parts of your system are given facility levels such as the kernel using the kern facility, or your mailing system using the mail facility.
If a third party wants to issue a log, it would probably be a reserved set of facility levels from 16 to 23 called “local use” facility levels.
Alternatively, they can use the “user-level” facility, meaning that they would issue logs related to the user that issued the commands.
In short, if my Apache server is run by the “apache” user, then the logs would be stored under a file called “apache.log” (<user>.log)
Here are the Syslog facility levels described in a table:
| Numerical Code | Keyword | Facility name |
| 0 | kern | Kernel messages |
| 1 | user | User-level messages |
| 2 | Mail system | |
| 3 | daemon | System Daemons |
| 4 | auth | Security messages |
| 5 | syslog | Syslogd messages |
| 6 | lpr | Line printer subsystem |
| 7 | news | Network news subsystem |
| 8 | uucp | UUCP subsystem |
| 9 | cron | Clock daemon |
| 10 | authpriv | Security messages |
| 11 | ftp | FTP daemon |
| 12 | ntp | NTP subsystem |
| 13 | security | Security log audit |
| 14 | console | Console log alerts |
| 15 | solaris-cron | Scheduling logs |
| 16-23 | local0 to local7 | Locally used facilities |
Do those levels sound familiar to you?
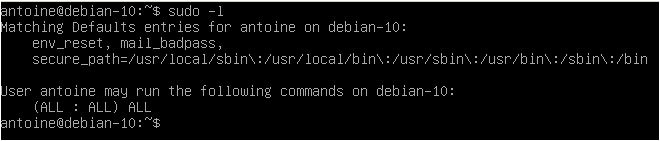
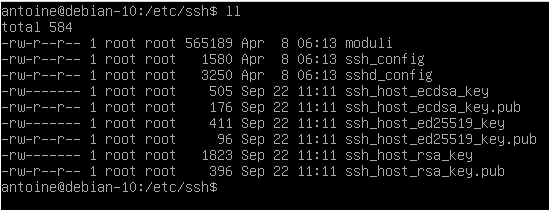
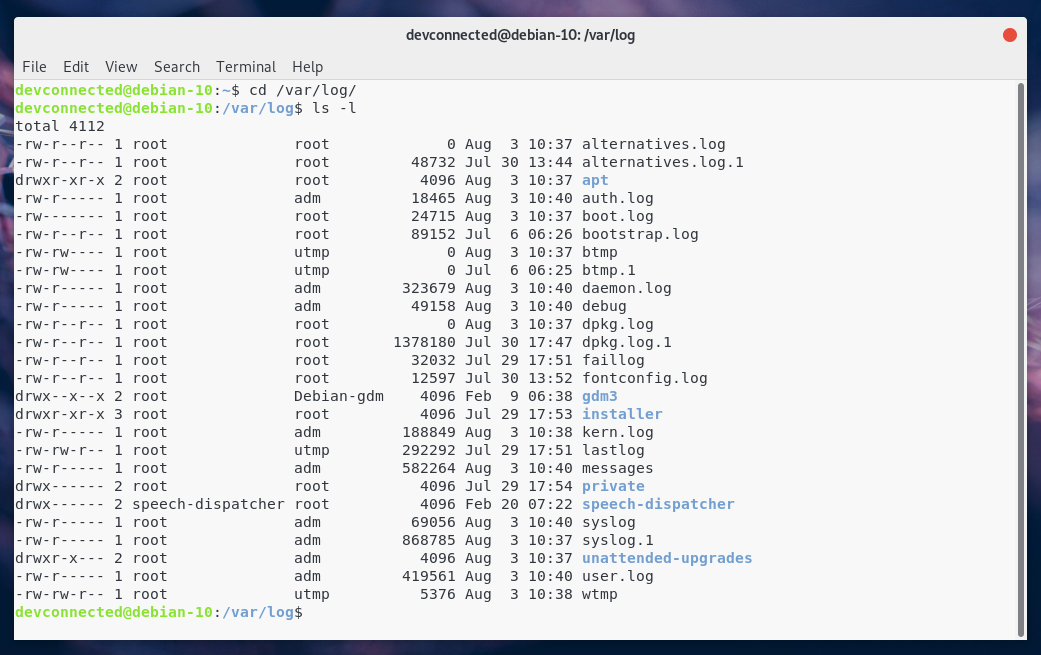
Yes! On a Linux system, by default, files are separated by facility name, meaning that you would have a file for auth (auth.log), a file for the kernel (kern.log), and so on.
Here’s a screenshot example of my Debian 10 instance.
Now that we have seen syslog facility levels, let’s describe what syslog severity levels are.
b – What are Syslog severity levels?
Syslog severity levels are used to how severe a log event is and they range from debugging, informational messages to emergency levels.
Similar to Syslog facility levels, severity levels are divided into numerical categories ranging from 0 to 7, 0 being the most critical emergency level.
Here are the syslog severity levels described in a table:
| Value | Severity | Keyword |
| 0 | Emergency | emerg |
| 1 | Alert | alert |
| 2 | Critical | crit |
| 3 | Error | err |
| 4 | Warning | warning |
| 5 | Notice | notice |
| 6 | Informational | info |
| 7 | Debug | debug |
Even if logs are stored by facility name by default, you could totally decide to have them stored by severity levels instead.
If you are using rsyslog as a default syslog server, you can check rsyslog properties to configure how logs are separated.
Now that you know a bit more about facilities and severities, let’s go back to our syslog message format.
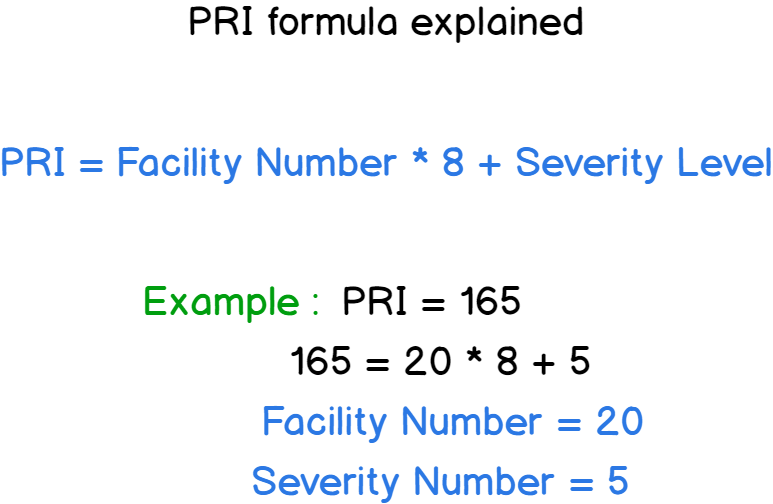
c – What is the PRI part?
The PRI chunk is the first part that you will get to read on a syslog formatted message.
The PRI stores the “Priority Value” between angle brackets.
Remember the facilities and severities you just learned?
If you take the message facility number, multiply it by eight, and add the severity level, you get the “Priority Value” of your syslog message.
Remember this if you want to decode your syslog message in the future.
d – What is the HEADER part?
As stated before, the HEADER part is made of two crucial information: the TIMESTAMP part and the HOSTNAME part (that can sometimes be resolved to an IP address)
This HEADER part directly follows the PRI part, right after the right angle bracket.
It is noteworthy to say that the TIMESTAMP part is formatted on the “Mmm dd hh:mm:ss” format, “Mmm” being the first three letters of a month of the year.
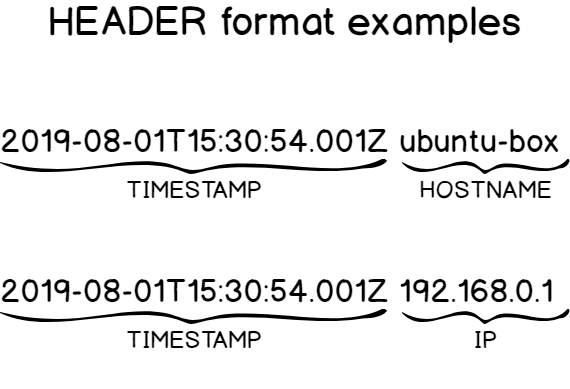
When it comes to the HOSTNAME, it is often the one given when you type the hostname command. If not found, it will be assigned either the IPv4 or the IPv6 of the host.
How does Syslog message delivery work?
When issuing a syslog message, you want to make sure that you use reliable and secure ways to deliver log data.
Syslog is of course opiniated on the subject, and here are a few answers to those questions.
a – What is Syslog forwarding?
Syslog forwarding consists of sending clients’ logs to a remote server in order for them to be centralized, making log analysis and visualization easier.
Most of the time, system administrators are not monitoring one single machine, but they have to monitor dozens of machines, on-site and off-site.
As a consequence, it is a very common practice to send logs to a distant machine, called a centralized logging server, using different communication protocols such as UDP or TCP.
b – Is Syslog using TCP or UDP?
As specified on the RFC 3164 specification, syslog clients use UDP to deliver messages to syslog servers.
Moreover, Syslog uses port 514 for UDP communication.
However, on recent syslog implementations such as rsyslog or syslog-ng, you have the possibility to use TCP (Transmission Control Protocol) as a secure communication channel.
For example, rsyslog uses port 10514 for TCP communication, ensuring that no packets are lost along the way.
Furthermore, you can use the TLS/SSL protocol on top of TCP to encrypt your Syslog packets, making sure that no man-in-the-middle attacks can be performed to spy on your logs.
If you are curious about rsyslog, here’s a tutorial on how to setup a complete centralized logging server in a secure and reliable way.
What are current Syslog implementations?
Syslog is a specification, but not the actual implementation in Linux systems.
Here is a list of current Syslog implementations on Linux:
- Syslog daemon: published in 1980, the syslog daemon is probably the first implementation ever done and only supports a limited set of features (such as UDP transmission). It is most commonly known as the sysklogd daemon on Linux;
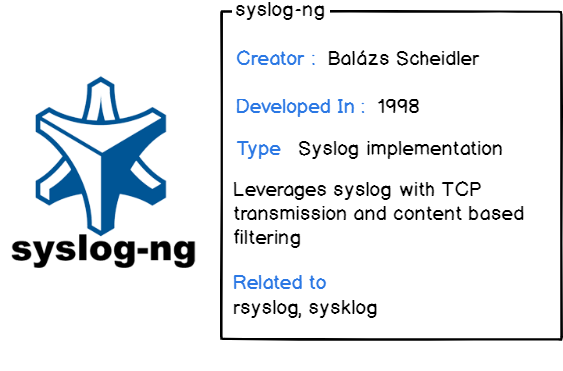
- Syslog-ng: published in 1998, syslog-ng extends the set of capabilities of the original syslog daemon including TCP forwarding (thus enhancing reliability), TLS encryption, and content-based filters. You can also store logs to local databases for further analysis.
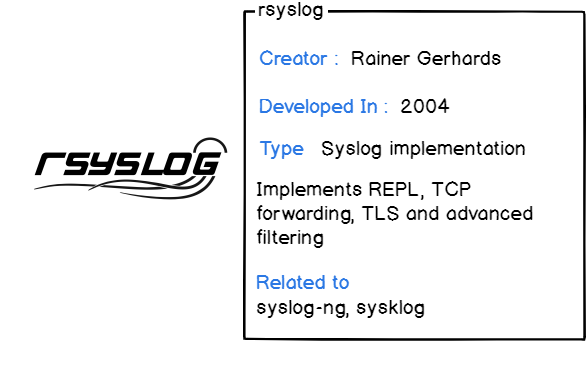
- Rsyslog: released in 2004 by Rainer Gerhards, rsyslog comes as a default syslog implementation on most of the actual Linux distributions (Ubuntu, RHEL, Debian, etc..). It provides the same set of features as syslog-ng for forwarding but it allows developers to pick data from more sources (Kafka, a file, or Docker for example)
Best Practices of the Syslog
When manipulating Syslog or when building a complete logging architecture, there are a few best practices that you need to know:
- Use reliable communication protocols unless you are willing to lose data. Choosing between UDP (a non-reliable protocol) and TCP (a reliable protocol) really matters. Make this choice ahead of time;
- Configure your hosts using the NTP protocol: when you want to work with real-time log debugging, it is best for you to have hosts that are synchronized, otherwise, you would have a hard time debugging events with good precision;
- Secure your logs: using the TLS/SSL protocol surely has some performance impacts on your instance, but if you are to forward authentication or kernel logs, it is best to encrypt them to make sure that no one is having access to critical information;
- You should avoid over-logging: defining a good log policy is crucial for your company. You have to decide if you are interested in storing (and essentially consuming bandwidth) for informational or debug logs for example. You may be interested in having only error logs for example;
- Backup log data regularly: if you are interested in keeping sensitive logs, or if you are audited on a regular basis, you may be interested in backing up your log on an external drive or on a properly configured database;
- Set up log retention policies: if logs are too old, you may be interested in dropping them, also known as “rotating” them. This operation is done via the logrotate utility on Linux systems.
Conclusion
The Syslog protocol is definitely a classic for system administrators or Linux engineers willing to have a deeper understanding of how logging works on a server.
However, there is a time for theory, and there is a time for practice.
So where should you go from there? You have multiple options.
You can start by setting up a Syslog server on your instance, like a Kiwi Syslog server for example, and starting gathering data from it.
Or, if you have a bigger infrastructure, you should probably start by setting up a centralized logging architecture, and later on, monitor it using very modern tools such as Kibana for visualization.
I hope that you learned something today.
Until then, have fun, as always.
Read More: