Finding all monitoring platforms installation on Docker is very tricky but we are yet with this magical tutorial where you all gonna learn How To Install InfluxDB Telegraf and Grafana on Docker. Not only installation, configuration, and setup but also basics about three platforms such as InfluxDB Telegraf and Grafana.
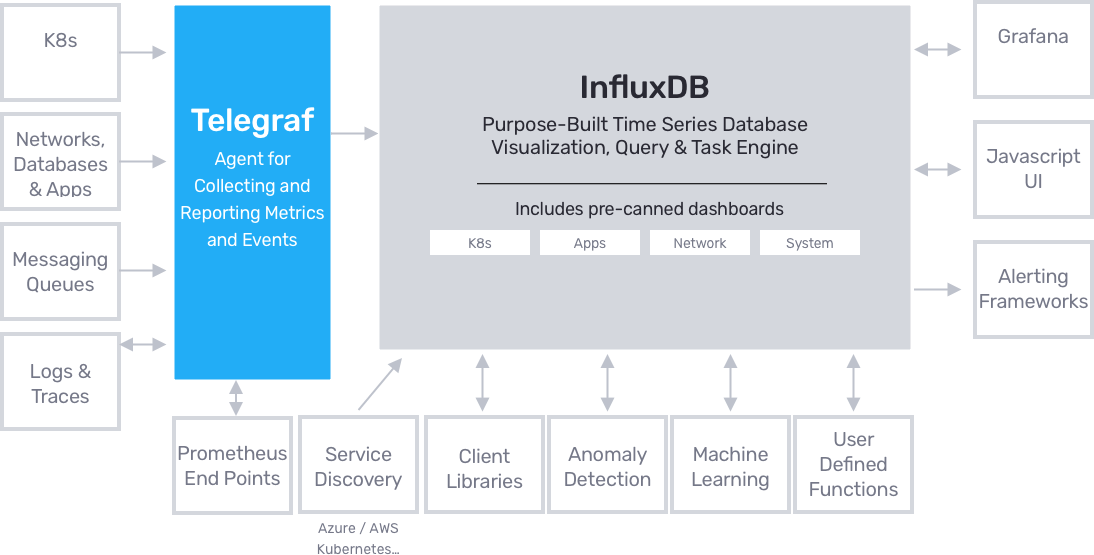
InfluxDB is one of the most used time-series databases nowadays and was created in 2013 by InfluxData. Telegraf is a plugin-driven server agent for collecting and sending metrics and events from databases, systems, and IoT sensors. Grafana is a free and open-source (FOSS/OSS) visualization tool utilized on top of a variety of diverse data stores but is most commonly used together with Graphite, InfluxDB, Prometheus, and Elasticsearch
On the other hand, Docker is a virtualization environment that provides an easy way to create, manage and delete containers on the fly.
- How To Setup Telegraf InfluxDB and Grafana on Linux | TIG Stack Setup on Linux
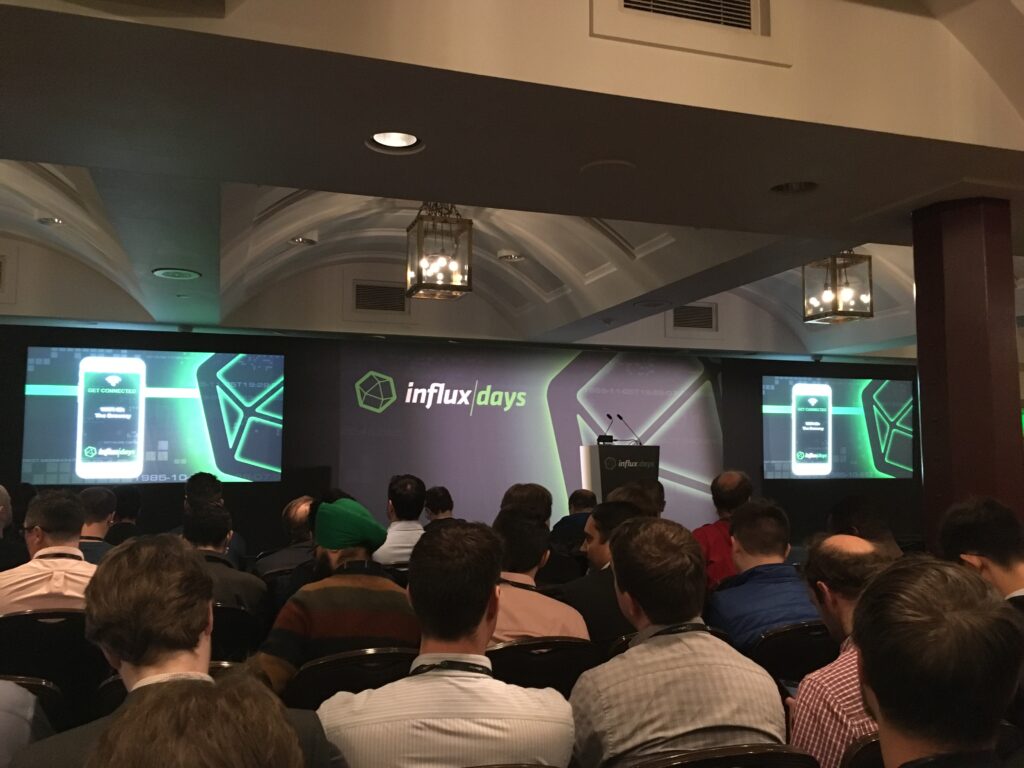
- InfluxDays London 2021 Recap | Key Facts of InfluxDays London 2021
- How To Install InfluxDB 1.7 and 2.0 on Linux in 2021
All these were the most widely used for monitoring and dashboarding in the DevOps industry by many successful companies in the world. If you are seeking help to install any one of these tools on docker then follow this tutorial till to the end and make installation of InfluxDB Telegraf and Grafana on Docker easily.
Note: InfluxDB is currently shifting to Influx 2.0, providing a single platform to manage all the components of the TICK stack. As a result, another tutorial will be available for InfluxDB 2.0.
- Prerequisites
- Installing InfluxDB 1.7.x on Docker
- Installing Telegraf on Docker
- Installing Grafana on Docker
- How to setup telegraph, influxdb, and grafana with Docker compose?
- Conclusion
Prerequisites
The requirements that you should do prior to install InfluxDB Telegraf and Grafana on Docker are as follows:
- Sudo privileges
- Installation & Configuration of Docker Correctly
- Designing the network strategy for InfluxDB
Sudo privileges
First of all, you need to have sudo rights on your Linux machine, otherwise, you won’t be able to install InfluxDB on your host.
To verify it, run the following command
$ sudo -v
If no error messages are shown on your terminal, you are good to go.
Next, you want to make sure that Docker is correctly installed on your system.
Installation & Configuration of Docker Correctly
To install Docker on Ubuntu and Debian, you can follow this tutorial. It provides great and extensive details on how to correctly set up Docker on Linux.
Again, to verify that Docker is correctly installed, you can run the following command.
$ docker --version
Docker version 19.03.1, build 74b1e89
Now that Docker is ready, let’s have a quick look at the networking strategy we are going to use for our containers.
Also Check:
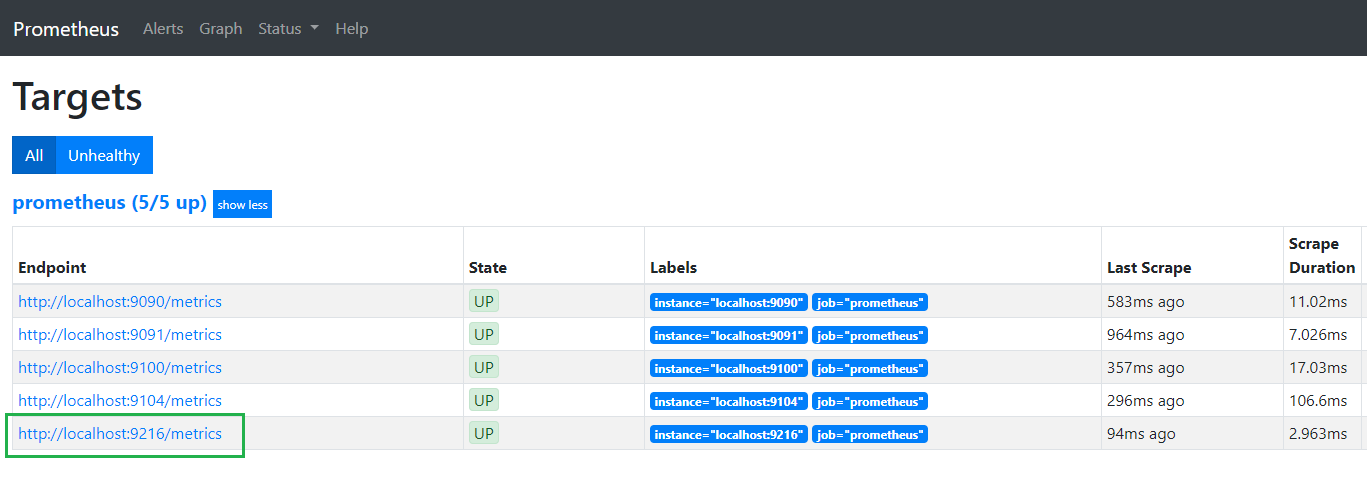
- How To Install Prometheus with Docker on Ubuntu 18.04
- How To Install Docker on Windows 7/8/10 Home and Pro
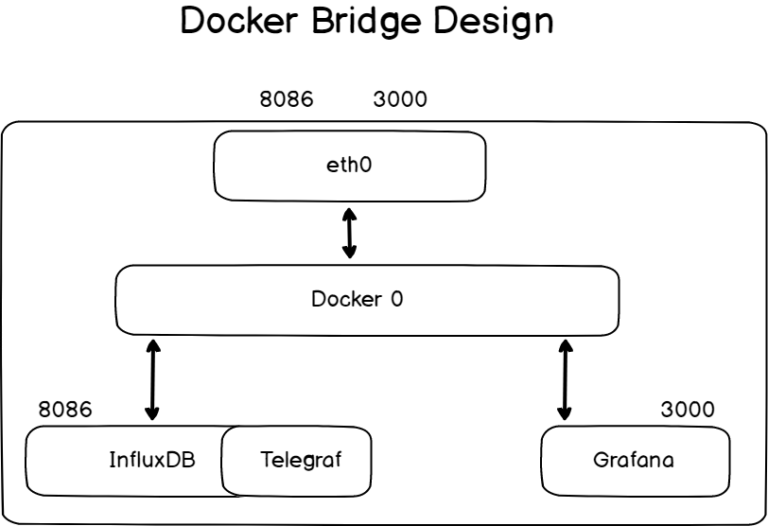
Designing the network strategy for InfluxDB
Before starting, it is important to have a few words about networking.
By default, containers are created to run on the bridge network stack.
By default, you will install InfluxDB, which will expose useful ports (like the 8086 one) to your current network stack.
Later on, you will bind Telegraf to it, but Telegraf does not have to expose any ports to your current host stack.
As a consequence, we can run InfluxDB on the default bridge network, and have Telegraf running in the same stack as InfluxDB.
Later on, we will add Grafana to our bridge network in order to visualize metrics gathered by Telegraf
Now that we have seen the network strategy we are going to use, let’s install the InfluxDB container for Docker.
To install InfluxDB on Docker, you have two ways of doing it.
You can either prepare your filesystem manually and run the InfluxDB on a Docker container with no initialization scripts.
This is the simplest way of initializing InfluxDB.
This method should be used if you plan on running InfluxDB on a single instance, if your initial InfluxDB configuration is very simple, or if you prefer to have full control over your containers.
However, there is a way to initialize InfluxDB with scripts (either bash scripts, or InfluxQL scripts).
This is the version that you should use if you are automating a lot of servers with InfluxDB (with Chef or Puppet for example), and you want to have the same initial setup on all your instances.
Installing InfluxDB 1.7.x on Docker
https://www.youtube.com/watch?v=0CpHwszFjUY
The official InfluxDB image for Docker is named: influxdb.
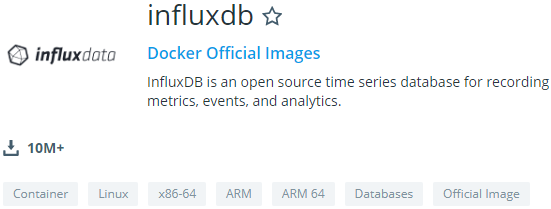
It is part of the Docker Official Images, so you can check that you are running an official version of InfluxDB on your system.
Moreover, the other tools of the TICK stack (Telegraf, InfluxDB, Chronograf, and Kapacitor) belong to the Docker Official Images.
The InfluxDB image is going to install the InfluxDB server responsible for storing time-series metrics on your system.
If you are familiar with Docker, you already know that you can map volumes from your local filesystem to your container in order to manipulate data easier in your container.
This is exactly what we are going to do in this tutorial.
Configuration files, as well as directories storing actual data, will be stored on our local filesystem.
a – Prepare InfluxDB 1.7.x for Docker
If you carefully followed the tutorial on setting up InfluxDB on Ubuntu, you know that you are going to create a specific user for your InfluxDB database.
$ sudo useradd -rs /bin/false influxdb
In your etc directory, create a new folder for your InfluxDB configuration files.
$ sudo mkdir -p /etc/influxdb
Creating a configuration file for InfluxDB and Docker
Luckily, you don’t have to create an InfluxDB configuration file by yourself.
To create an InfluxDB configuration file using Docker, run the following command.
docker run --rm influxdb influxd config | sudo tee /etc/influxdb/influxdb.conf > /dev/nullAs a quick explanation, the “influxd config” command will print a full InfluxDB configuration file for you on the standard output (which is by default your shell)
As the –rm option is set, Docker will run a container in order to execute this command and the container will be deleted as soon as it exists.
Instead of having the configuration file printed on the standard output, it will be redirected to our InfluxDB configuration file.
Next, reassign the folder permissions for your newly created file, otherwise, your container won’t be able to interact with it properly.
$ sudo chown influxdb:influxdb /etc/influxdb/*
Creating a lib folder for InfluxDB and Docker
As stated in the documentation, InfluxDB stores its data, metadata as well as the WAL (for write-ahead log) in the /var/lib/influxdb folder by default.
As a consequence, you have to create this folder if it is not currently existing.
$ sudo mkdir -p /var/lib/influxdb
Again, make sure that the permissions are correctly set for your container to write into this folder.
$ sudo chown influxdb:influxdb /var/lib/influxdb

Now that our folders are ready, let’s see how we can initialize InfluxDB with custom scripts.
Preparing initialization scripts for InfluxDB on Docker (optional)
With the InfluxDB image, there is a way to automate database initialization on your containers.
As an example, we will instruct our Docker container to create an administrator account, a regular user account (for Telegraf), and a database with custom retention via a custom InfluxQL script.
Anatomy of the InfluxDB image
On container boot, the entrypoint.sh script is executed, it is set as the entrypoint of your Docker container.
The entry point can be executed in two ways.
You can execute the entry point script in order to launch a simple InfluxDB instance on your container.
This is for example what we have done in the previous section. We specified the configuration flag and it was used in order to set your InfluxDB server initialization.
However, there is a second way to execute the entrypoint script: by executing the init-influxdb script.
The init-influxdb script is made of two parts :
- First, it will watch for environments variables passed to your docker command, and it will execute commands accordingly
- Next, if you have a docker-entrypoint-initdb.d directory at the root directory of your container, it will execute either bash scripts or IQL scripts in it.
We are going to use that information to create our InfluxDB container.
First, make sure that no folders are already created in your /var/lib/influxdb folder.
$ ls -l /var/lib/influxdb
total 0
Execute the following command for the meta folder (in the influxdb folder) to be updated with the correct information.
As a reminder, we want an admin account and a regular account for Telegraf (named telegraf)
Creating initialization scripts on your host
In order for the initialization scripts to be run on initialization, they have to be mapped to the docker-entrypoint-initdb.d folder in your container.
First, create a scripts folder on your host wherever you want.
In my case, it is going to be created in /etc/influxdb.
$ sudo mkdir -p /etc/influxdb/scripts
Edit a new script file on your newly created folder, and make sure to give it a .iql extension.
$ sudo touch influxdb-init.iql

CREATE DATABASE weather;
CREATE RETENTION POLICY one_week ON weather DURATION 168h REPLICATION 1 DEFAULT;
This simple initialization script will create a database for weather data, and it will assign a one-week retention policy for it.
Great!
The last step will be to prepare our meta folder for InfluxDB initialization.
Creating/updating the InfluxDB Meta Database
In order to update your meta database, run the following command
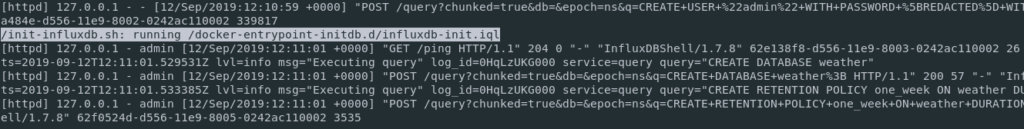
$ docker run --rm -e INFLUXDB_HTTP_AUTH_ENABLED=true \
         -e INFLUXDB_ADMIN_USER=admin \
         -e INFLUXDB_ADMIN_PASSWORD=admin123 \
         -v /var/lib/influxdb:/var/lib/influxdb \
         -v /etc/influxdb/scripts:/docker-entrypoint-initdb.d \
         influxdb /init-influxdb.sh
Note: Setting the INFLUXDB_HTTP_AUTH_ENABLED to true does not mean that authentication is enabled on your InfluxDB server. Authentication is enabled in one of the next sections, this parameter is only used for the initialization script.
A couple of logs should be printed on your terminal.
If this is not the case, make sure that you specified the correct environments variables for your container.
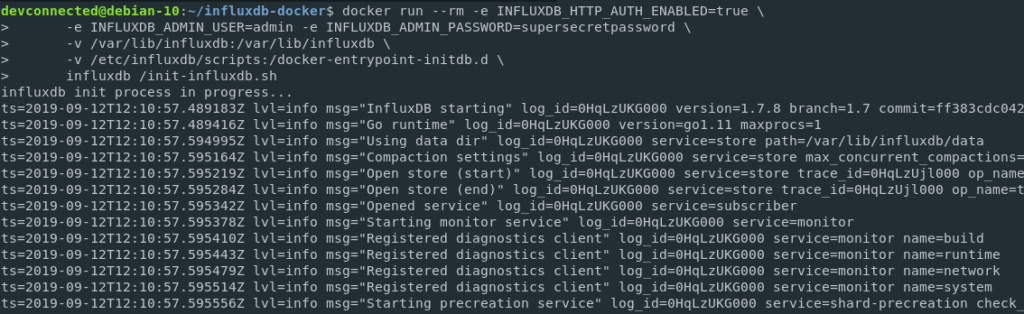
If you chose to create initialization scripts for your container, you should also have a log line for it.
As the last verification step, you can inspect your meta.db file in your meta folder to make sure that the changes were correctly written.
$ cat /var/lib/influxdb/meta/meta.db | grep one_week

Now that your InfluxDB files are prepared, let’s head over to some configuration verifications.
b – Verifying your InfluxDB configuration for Docker
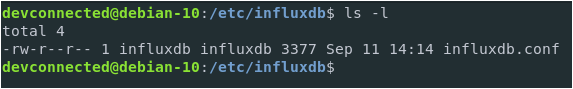
If you used the configuration command detailed in the section above, you should be presented with a simple configuration file in the /etc/influxdb folder.
Open your file and verify that everything is correct.
HTTP Interface
Head over to the [http] section of your configuration and make sure that it is enabled.
Verify the bind-address that should be 8086 by default.
This is the port that you are going to use to send some commands to your InfluxDB database, like creating a database or adding a user for example.
By default, authentication and encryption are disabled. However, sections of this tutorial explain how you can set up authentication in depth.
Data, meta, and WAL configurations
By default, your configuration file should have the paths that we created in the first section, so you don’t have to change anything.
However, you should check that your paths are correct.
[meta]
  dir = "/var/lib/influxdb/meta"

[data]
  dir = "/var/lib/influxdb/data"
  wal-dir = "/var/lib/influxdb/wal"
Running the InfluxDB container on Docker
We are going to use the InfluxDB image from the official Docker repositories.
As a quick reminder, you need to use the docker container run command in order to start a Docker container.
First, make sure that nothing is running on port 8086.
$ sudo netstat -tulpn | grep 8086
If you remember correctly, we configured our folders to be accessible by the InfluxDB user (belonging in the InfluxDB group).
As a consequence, we will need the user ID of the InfluxDB user in order to run our container.
To find the InfluxDB user ID, head over to the passwd file on your host and run
$ cat /etc/passwd | grep influxdb
influxdb:x:997:997::/var/lib/influxdb:/bin/false
As you can see, the user ID for my InfluxDB user is 997.
Note: The user ID will surely be different on your system, and you should modify it accordingly when running the docker command.
To start InfluxDB on Docker, run the following command.
docker run -d -p 8086:8086 --user 997:997 --name=influxdb \
-v /etc/influxdb/influxdb.conf:/etc/influxdb/influxdb.conf \
-v /var/lib/influxdb:/var/lib/influxdb \
influxdb \
-config /etc/influxdb/influxdb.conf
Testing your InfluxDB container
In order to test if your InfluxDB container is correctly running, you can check that the HTTP API is correctly enabled.
$ curl -G http://localhost:8086/query --data-urlencode "q=SHOW DATABASES"

You can also check that your InfluxDB server is correctly listening on port 8086 on your host.
$ netstat -tulpn | grep 8086
tcp6    0    0 :::8086      :::*       LISTEN       -
Awesome!
Your InfluxDB container is correctly running on Docker.
By default, your InfluxDB server does not contain any databases except for the _internal used, as its name describes, internal metrics about InfluxDB itself.
However, if you created initialization scripts for your InfluxDB database, make sure that your databases and retention policies are correctly assigned.
$ influx
Connected to http://localhost:8086 version 1.7.8
InfluxDB shell version: 1.7.7

> SHOW USERS

user    admin
----    -----
admin   true

> SHOW DATABASES
name: databases
name
----
weather
Enabling authentication on InfluxDB for Docker
In order to enable authentication for InfluxDB 1.7.x, you are going to create an administrator account for your InfluxDB database (if you didn’t use initialization scripts)
Create an administrator account with docker exec
You don’t have to create an administrator account if you initialized your InfluxDB image with environment variables in the previous sections.
This is only necessary if you choose a fully customized InfluxDB image that you configure yourself.
To create an administrator account, connect to a bash process in your container and run the influx utility by yourself.
To achieve that, run the following commands
$ docker container ls
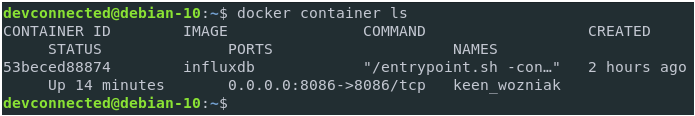
Note: Your container is not appearing here? Run this command with the -a (for all) flag to make sure that your container hasn’t crashed.
Identify the container ID of your InfluxDB container, and run the following command to have a bash in your container.
$ docker exec -it <container_id> /bin/bash
As a reminder, the docker exec is used in order to run a command in a running container.
Here are the options specified with it :
- -i: for interactive, it will keep the standard input open even if not attached
- -t: to allocate a pseudo-TTY to your current shell environment.
Right now, you should have a shell prompt, similar to this :

In your container, run the influx utility to create your administrator account.
$ influx
Connected to http://localhost:8086 version 1.7.8
InfluxDB shell version: 1.7.8
> CREATE USER admin WITH PASSWORD 'admin123' WITH ALL PRIVILEGES
> SHOW USERS
user  admin
----  -----
admin true
Now that you have an administrator account, you can enable HTTP authentication for your database.
Enable HTTP Authentication in your configuration file
To achieve that, exit your container, and head to the configuration folder you created for InfluxDB.
Ctrl + D (to exit your container)

$ sudo nano /etc/influxdb/influxdb.conf

[http]
  enabled = true
  bind-address = ":8086"
  auth-enabled = true
Save your file and restart your container for the changes to be applied.
$ docker container restart <container_id>
To make sure that your changes are effective, try querying the HTTP API again.
You should be unable to execute a query without specifying the correct credentials.
$ curl -G http://localhost:8086/query --data-urlencode "q=SHOW DATABASES"
{"error":"unable to parse authentication credentials"}
Great!
Authentication is correctly enabled.
Let’s try to execute the InfluxQL query again with the correct credentials.
$ curl -G -u admin:admin123 http://localhost:8086/query --data-urlencode "q=SHOW DATABASES"

{"results":[{"statement_id":0,"series":[{"name":"databases","columns":["name"],"values":[["_internal"]]}]}]}
With this curl command, we made sure that our credentials were correctly set up for our InfluxDB server.
Now that your time-series database is up and running, it is time to install our metrics collection agent: Telegraf.
Installing Telegraf on Docker
For those who are not familiar with Telegraf, Telegraf is a plugin-driven agent that periodically collects metrics about a variety of different systems.
The metrics are pushed to InfluxDB and they can be later on analyzed in Chronograf or Grafana.
Luckily, Telegraf also belongs to the official Docker images.
In this section, we are going to configure Telegraf for it to gather system metrics on our Linux host (in this case, a Debian 10, but it works in the same way for Ubuntu-based ones)
Prepare Telegraf for InfluxDB and Docker
Likewise to our InfluxDB setup, we are going to create a Telegraf user for our host. It ensures that correct permissions are set for our future configuration files.
$ sudo useradd -rs /bin/false telegraf
In your etc directory, create a new folder for your Telegraf configuration files.
$ sudo mkdir -p /etc/telegraf
Creating a configuration file for Telegraf and Docker
Again, we don’t have to create a Telegraf configuration file by ourselves.
The Telegraf Docker image is built very close to the InfluxDB one.
As a consequence, it is able to run a simple telegraf config command to generate a configuration on the fly.
By default, the Telegraf configuration file has the following defaults:
- interval: 10 seconds. Telegraf is going to gather and send metrics to InfluxDB every 10 seconds.
- round_interval: true. The agent is going to collect metrics on :00, :10, or :(00 + n*interval)
- The InfluxDB output plugin is enabled by default.
- The CPU, disk, diskio, kernel, memory, processes, swap, and system inputs plugins are enabled. As those inputs use the /proc mountpoint to gather metrics, we will have to remap volumes on the container.
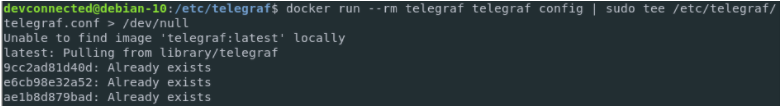
To create a Telegraf configuration file using Docker, run the following command.
docker run --rm telegraf telegraf config | sudo tee /etc/telegraf/telegraf.conf > /dev/null
Next, reassign the correct permissions to your Telegraf configuration folder.
This will ensure that only Telegraf itself and the root account are able to write to the configuration file.
$ sudo chown telegraf:telegraf /etc/telegraf/*
Modify your Telegraf configuration file
With Telegraf, most of the time, you will want to send metrics directly to InfluxDB itself.
This is why the InfluxDB output is enabled by default in your Telegraf configuration file.
By default, Telegraf will send metrics to a database named “telegraf” on InfluxDB.
This is a customizable parameter, however in this case we are only going to specify the InfluxDB authentication parameters.
Edit your Telegraf configuration file, and locate the [[outputs.influxdb]] section.
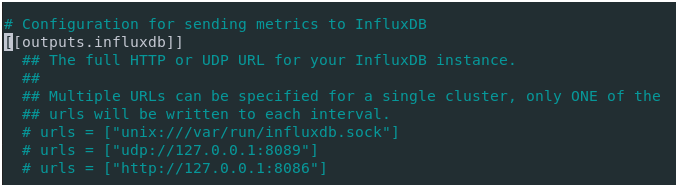
In this configuration file, locate the “HTTP Basic Auth” section and modify the credentials accordingly.
## HTTP Basic Auth
username = "admin"
password = "admin123"
You are of course free to create a dedicated administrator account for Telegraf by using the method we described above (using docker exec)
Save and exit your file, now it is time to run the container.
Running the Telegraf container on Docker
As stated before, Telegraf enables system inputs by default.
As a consequence, we will have to remap the /proc host folder to the /host folder on our Docker image.
This is made to ensure that Telegraf is not gathering metrics from the Docker container itself and that the container filesystem is not altered in any way.
To achieve this, unless you gave a name to your InfluxDB container, run this command to get your InfluxDB container ID.
It will be used to connect Telegraf and InfluxDB to the same virtual network.
$ docker container ls | grep influxdb
1939ba611410   influxdb   "/entrypoint.sh -conf..."   24 minutes ago    Up 30 minutes    0.0.0.0:8086->8086/tcp    ecstatic_moore
Isolate your Telegraf user ID by running the following command.
$ getent passwd | grep telegraf
telegraf:x:998:998::/etc/telegraf:/bin/false
Next, to run the Telegraf Docker image, run the following command.
$ docker run -d --user 998:998 --name=telegraf \
      --net=container:<influx_container_id> \
      -e HOST_PROC=/host/proc \
      -v /proc:/host/proc:ro \
      -v /etc/telegraf/telegraf.conf:/etc/telegraf/telegraf.conf:ro \
      telegraf
Note: The net option can be replaced by –net=influxdb if you chose to create your InfluxDB container with a name.
Great!
To make sure your Telegraf instance is running correctly, run the following command.
$ docker container logs -f --since 10m telegraf
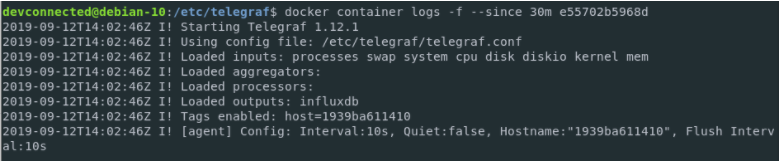
Telegraf seems no to raise any error messages, but let’s double-check the correctness of our setup by inspecting the InfluxDB database.
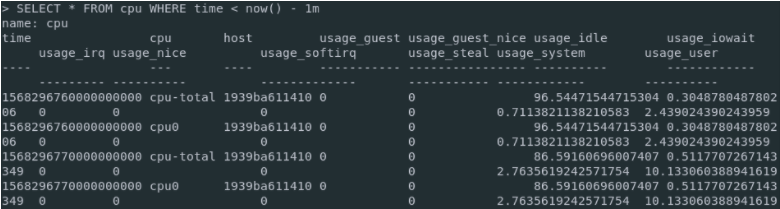
$ docker exec -it <container_id> influx -username admin -password admin123

InfluxDB shell version 1.7.8
> SHOW DATABASES

name: databases
name
----
weather
_internal
telegraf

> USE telegraf
> SELECT * FROM cpu WHERE time < now() - 1m
If you are seeing data points, congratulations!
Your Telegraf instance is correctly sending metrics to your InfluxDB server.
Now that all metrics are stored in Telegraf, for one week, we can install a modern dashboarding tool in order to visualize them: Grafana.
Visualizing Telegraf metrics in Grafana
For those who are unfamiliar with Grafana, Grafana is a dashboarding tool that binds to a wide variety of different datasources in order to create beautiful graphs.
It can bind to traditional SQL databases, but it can also bind to time series databases, which is what we are going to do in this section.
Installing Grafana on Docker
The Grafana docker image is stored under the Grafana repository.
To create a Grafana container, run the following command on your host.
$ docker run -d --name=grafana -p 3000:3000 grafana/grafana
A Grafana server container should now be up and running on your host. To make sure of it, run the following command.
$ docker container ls | grep grafana
You can also make sure that it is correctly listening on port 3000.
$ netstat -tulpn | grep 3000
Configuring Grafana for InfluxDB
With your web browser, head over to
You should be redirected to the Grafana home page.
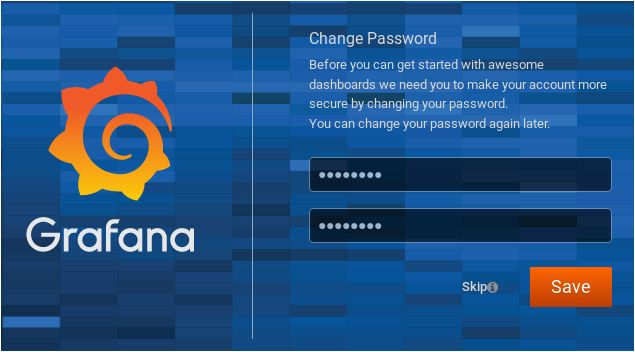
The default credentials for Grafana are admin/admin.
Immediately, you are asked to change your password. Choose a strong password and click on “Save“
You should now be redirected to the Grafana default Web UI.
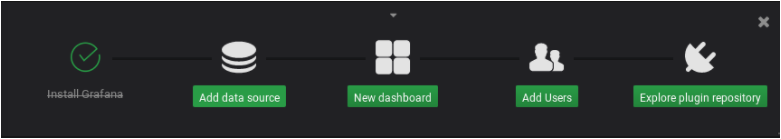
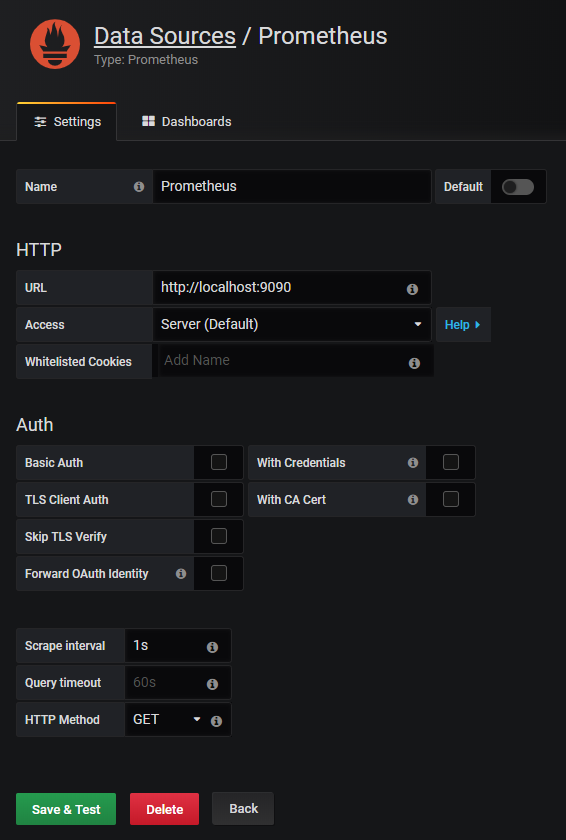
Click on “Add data source” to add an InfluxDB datasource.
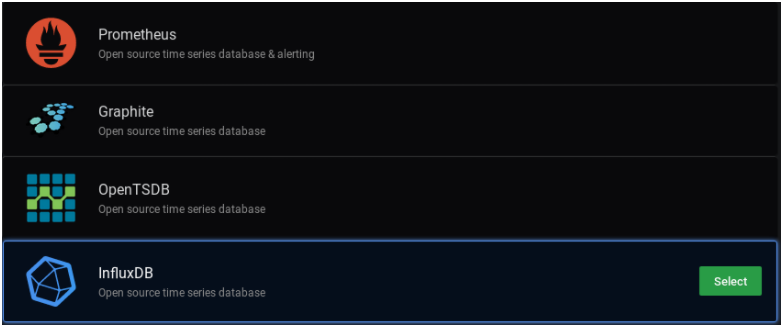
Next, select the InfluxDB option and click on “Select“.
For this tutorial, we are not using InfluxDB images as Docker services. As a consequence, we have to isolate InfluxDB public IP on our bridge network.
To do that, run the following command
$ docker network inspect bridge | grep influxdb -A 5
"Name": "influxdb",
"EndpointID": "7e4eb0574a346687efbb96b6b45",
"MacAddress": "02:42:ac:11:00:04",
"IPv4Address": "172.17.0.2/16",
"IPv6Address": ""
Copy the IPv4 address and paste it into the InfluxDB configuration for Grafana.
Select the Basic Auth option, specify your administrator credentials, and fill in the details about your InfluxDB database.
Here is the final configuration.
Click on “Save and Test” to make sure that your configuration is working properly.
Awesome!
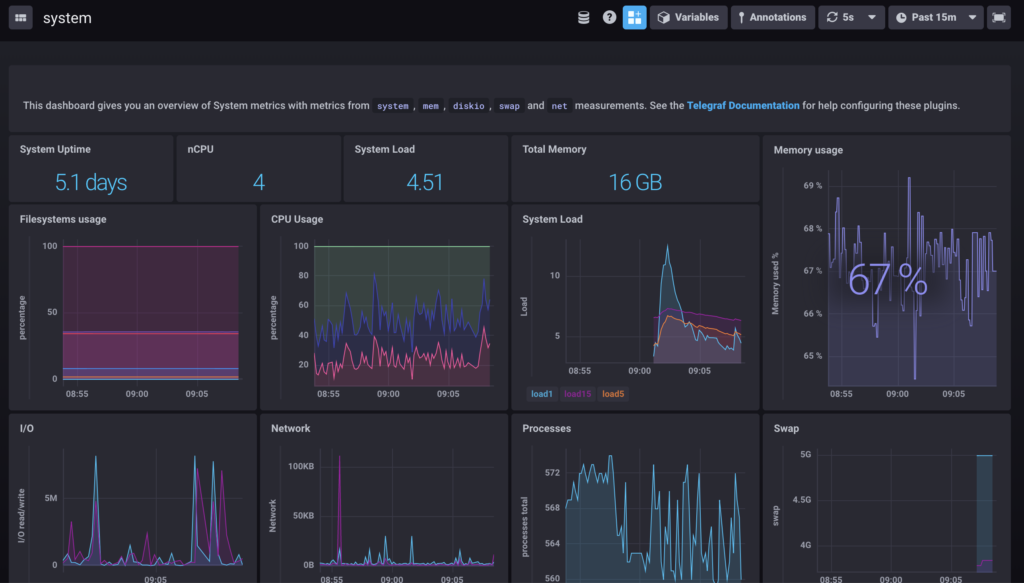
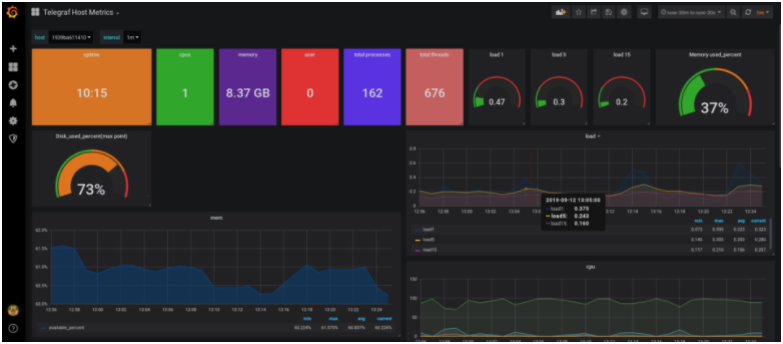
Now that everything is set up in Grafana, let’s import a dashboard designed for Telegraf host metrics.
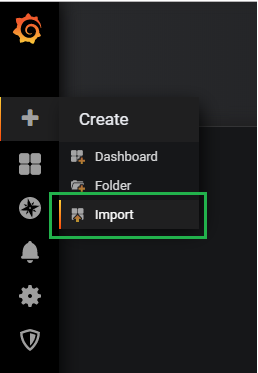
Importing a Grafana dashboard
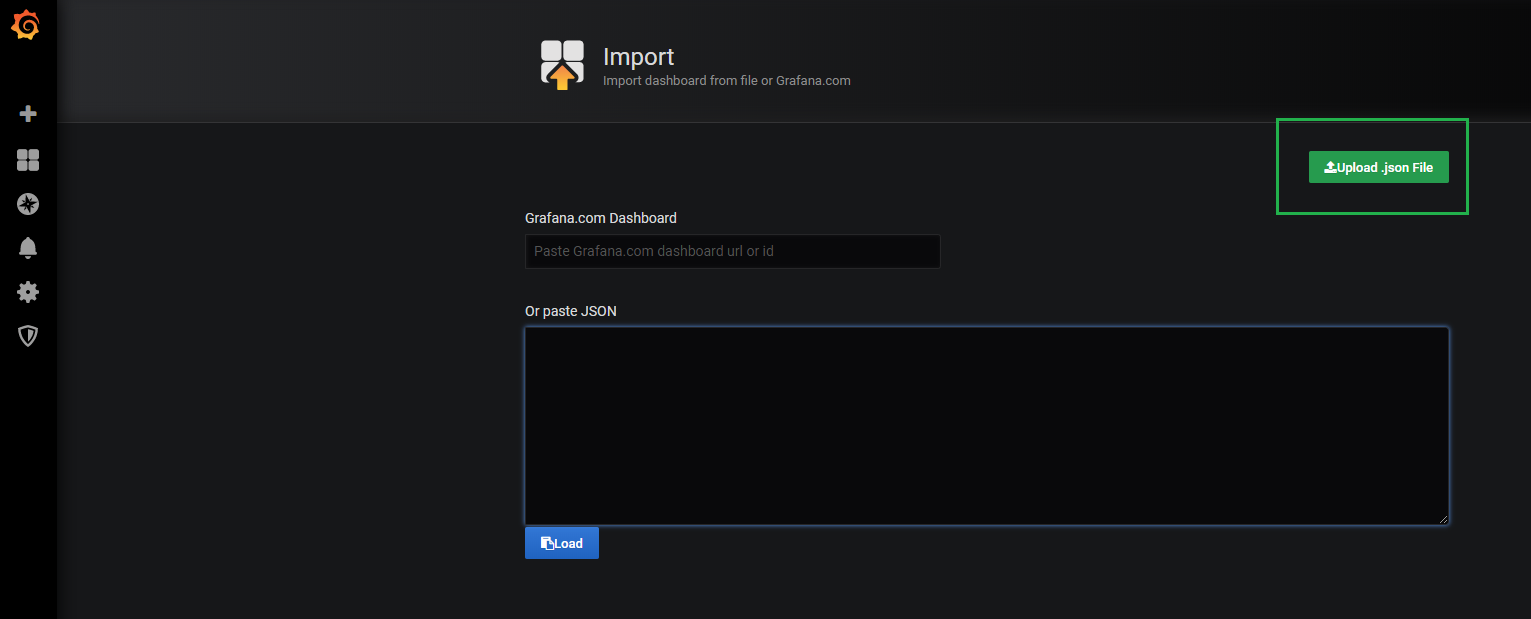
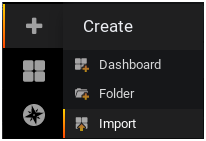
To import a Grafana dashboard, select the “Plus” icon in the left menu, and click on “Import“.
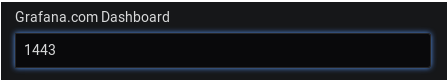
In the import text box, put 1443 as a dashboard ID.
In the next window, make sure that the information is correct and bind it to your newly created datasource.
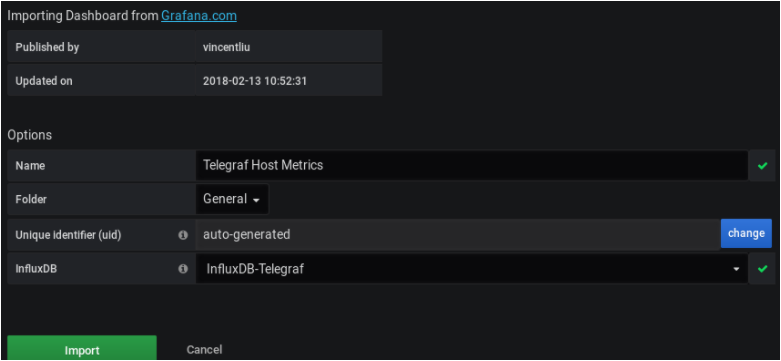
Click on “Import” and your dashboard should be up and running!
Do Check Some Other Grafana Tutorials from here:
- How To Create a Grafana Dashboard? (UI + API methods)
- MongoDB Monitoring with Grafana & Prometheus
- Complete MySQL dashboard with Grafana & Prometheus
How to setup telegraph, influxdb, and grafana with Docker compose?
Conclusion
Congratulations, you learned how to install InfluxDB 1.7.x, Telegraf and Grafana using Docker.
As you can realize that this tutorial concentrates on a fully customizable installation of your images. In case you want to automate your container setups, it might be a good idea to use docker-compose.
Furthermore, ensure to read through the entire list of Telegraf input plugins to start getting ideas about what to monitor. Until then, have fun & enjoy the work with discovering our docker tutorials, as always.