
Elasticsearch is a platform for distributed search and data analysis in real-time. It offers a multitenant-capable full-text search engine with an HTTP web interface and schema-free JSON documents with a simple installation.
By Elasticsearch, you can execute and combine various types of searches giving you the like Kibana, Logstash, X-Pack, etc., Elasticsearch can collect and monitor Big Data at a large scale. This Elasticsearch cluster includes three data nodes and with this, we could avoid a split-brain and have a quorum of master-eligible nodes.
- Monitoring Linux Logs with Kibana and Rsyslog | Using Kibana and Rsyslog to monitor Linux logs
- How To Install Logstash on Ubuntu 18.04 and Debian 9 | Tutorial on Logstash Configuration
- 4 Best Open Source Dashboard Monitoring Tools In 2021
In this free and ultimate tutorial, we will be going to learn how to install and configure a 3 Node Elasticsearch Cluster on Ubuntu 18.04 and with this you can go through some API examples on creating indexes, ingesting documents, searches, etc.![]()
- What is ElasticSearch?
- Basic Concepts of Elasticsearch
- Note on Master Elections
- Prerequisites
- Installing Elasticsearch on Ubuntu
- Configuring Elasticsearch
- Start Elasticsearch
- Using Elasticsearch Restful API
- View Cluster Health
- View the Number of Nodes in your Cluster
- Create your first Elasticsearch Index
- Replicating a Yellow Cluster Status
- Ingest Data into Elasticsearch
- Search Queries
- Delete your Index
What is ElasticSearch?
ElasticSearch is a highly scalable open-source analytics engine, RESTful search engine built on top of Apache Lucene and issued under an Apache license. It is the most famous search engine and is generally used for full-text search, log analytics, security intelligence, business analytics, analyze big volumes of data faster and in near real-time, etc. Also, Elasticsearch is Java-based and can search and index document files in different formats.

Before we get to the main topic, let’s cover some basics about Elasticsearch from below:
Basic Concepts of Elasticsearch
- An Elasticsearch Cluster is made up of a number of nodes;
- Each Node includes Indexes, where an Index is a Collection of Documents;
- Master nodes are subjective for Cluster related tasks, creating/deleting indexes, tracking of nodes, allocate shards to nodes;
- Data nodes are liable for hosting the actual shards that have the indexed data also handles data related operations like CRUD, search, and aggregations;
- Indexes are split into Multiple Shards;
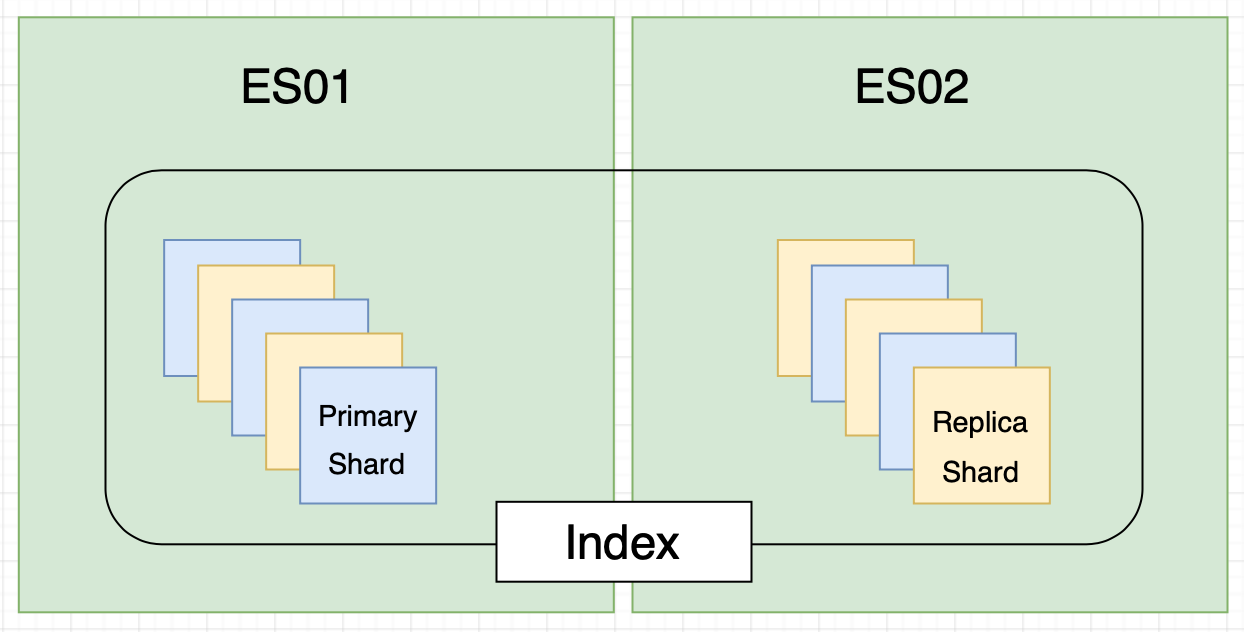
- Shards exist of Primary Shards and Replica Shards;
- A Replica Shard is a Copy of a Primary Shard that is used for HA/Redundancy;
- Shards get placed on random nodes throughout the cluster;
- A Replica Shard will NEVER be on the same node as the Primary Shard’s associated shard-id.
Note on Master Elections
The least number of master eligible nodes that want to join a newly elected master in order for an election is configured via the setting discovery.zen.minimum_master_nodes. This configuration is very powerful, as it makes each master-eligible node informed of the minimum number of master-eligible nodes that must be visible in order to form a cluster.
Without this setting or incorrect configuration, this might lead to a split-brain, where let’s say something went wrong and upon nodes rejoining the cluster, it may form 2 different clusters, which we want to avoid at all costs.
From consulting elasticsearch documentation, to avoid a split brain, this setting should be set to a quorum of master-eligible nodes via the following formula:
(master_eligible_nodes / 2) + 1
# in our case:
(3/2) + 1 = 2
It is advised to evade having only two master eligible nodes since a quorum of two is two. To read more on elasticsearch cluster master election process, take a look at their documentation
Prerequisites
We have to set the internal IP addresses of our nodes to either our hosts’ file or DNS server. To keep it easy & straightforward, I will add them to my host file. This needs to apply to both nodes:
$ sudo su -
$ cat > /etc/hosts << EOF
127.0.0.1 localhost
172.31.0.77 es-node-1
172.31.0.45 es-node-2
172.31.0.48 es-node-3
EOF
Now that our host entries are set, we can start with the fun stuff.
Installing Elasticsearch on Ubuntu
The following instructions and directions should be implemented to both nodes.
Get the Elasticsearch repositories and update your system so that your servers are aware of the newly added Elasticsearch repository:
$ apt update && apt upgrade -y
$ apt install software-properties-common python-software-properties apt-transport-https -y
$ wget -qO - https://artifacts.elastic.co/GPG-KEY-elasticsearch | sudo apt-key add -
$ echo "deb https://artifacts.elastic.co/packages/6.x/apt stable main" | sudo tee -a /etc/apt/sources.list.d/elastic-6.x.list
$ apt update
Elasticsearch relies on Java, so install the java development kit:
$ apt install default-jdk -y
Verify that java is installed:
$ java -version
openjdk version "11.0.3" 2019-04-16
OpenJDK Runtime Environment (build 11.0.3+7-Ubuntu-1ubuntu218.04.1)
OpenJDK 64-Bit Server VM (build 11.0.3+7-Ubuntu-1ubuntu218.04.1, mixed mode, sharing)
Install Elasticsearch:
$ apt install elasticsearch -y
Once Elasticsearch is installed, repeat these steps on the second node. Once that is done, move on to the configuration section.
Configuring Elasticsearch
For nodes to join the same cluster, they should all share the same cluster name.
We also need to specify the discovery hosts as the masters so that the nodes can be discoverable. Since we are installing a 3 node cluster, all nodes will contribute to a master and data node role.
Feel free to inspect the Elasticsearch cluster configuration, but I will be overwriting the default configuration with the config that I need.
Make sure to apply the configuration on both nodes:
$ cat > /etc/elasticsearch/elasticsearch.yml << EOF
cluster.name: es-cluster
node.name: \${HOSTNAME}
node.master: true
node.data: true
path.logs: /var/log/elasticsearch
path.data: /usr/share/elasticsearch/data
bootstrap.memory_lock: true
network.host: 0.0.0.0
discovery.zen.minimum_master_nodes: 2
discovery.zen.ping.unicast.hosts: ["es-node-1", "es-node-2"]
EOF
Important settings for your elasticsearch cluster is described on their docs:
- Disable swapping
- Increase file descriptors
- Ensure sufficient virtual memory
- Ensure sufficient threads
- JVM DNS cache settings
- Temporary directory not mounted with noexec
Increase the file descriptors on the nodes, as instructed by the documentation:
$ cat > /etc/default/elasticsearch << EOF
ES_STARTUP_SLEEP_TIME=5
MAX_OPEN_FILES=65536
MAX_LOCKED_MEMORY=unlimited
EOF
Ensure that pages are not swapped out to disk by requesting the JVM to lock the heap in memory by setting LimitMEMLOCK=infinity.
Set the maximum file descriptor number for this process: LimitNOFILE and increase the number of threads using LimitNPROC:
$ vim /usr/lib/systemd/system/elasticsearch.service
[Service]
LimitMEMLOCK=infinity
LimitNOFILE=65535
LimitNPROC=4096
...
Increase the limit on the number of open files descriptors to user elasticsearch of 65536 or higher
$ cat > /etc/security/limits.conf << EOF
elasticsearch soft memlock unlimited
elasticsearch hard memlock unlimited
EOF
Increase the value of the map counts as elasticsearch uses maps directory to store its indices:
$ sysctl -w vm.max_map_count=262144
For a permanent setting, update vm.max_map_count in /etc/sysctl.conf and run:
$ sysctl -p /etc/sysctl.conf
Change the permissions of the elasticsearch data path, so that the elasticsearch user and group has permissions to read and write from the configured path:
$ chown -R elasticsearch:elasticsearch /usr/share/elasticsearch
Make sure that you have applied these steps to all the nodes before continuing.
Start Elasticsearch
Enable Elasticsearch on boot time and start the Elasticsearch service:
$ systemctl enable elasticsearch
$ systemctl start elasticsearch
Verify that Elasticsearch is running:
$ netstat -tulpn
Active Internet connections (only servers)
Proto Recv-Q Send-Q Local Address           Foreign Address         State       PID/Program name
tcp6       0      0 :::9200                 :::*                    LISTEN      278/java
tcp6       0      0 :::9300                 :::*                    LISTEN      278/java
Using Elasticsearch Restful API
In this section we will get comfortable with using Elasticsearch API, by covering the following examples:
- Cluster Overview;
- How to view Node, Index, and Shard information;
- How to Ingest Data into Elasticsearch;
- Who to Search data in Elasticsearch;
- How to delete your Index
View Cluster Health
From any node, use an HTTP client such as curl to investigate the current health of the cluster by looking at the cluster API:
$ curl -XGET http://localhost:9200/_cluster/health?pretty
{
  "cluster_name" : "es-cluster",
  "status" : "green",
  "timed_out" : false,
  "number_of_nodes" : 3,
  "number_of_data_nodes" : 3,
  "active_primary_shards" : 0,
  "active_shards" : 0,
  "relocating_shards" : 0,
  "initializing_shards" : 0,
  "unassigned_shards" : 0,
  "delayed_unassigned_shards" : 0,
  "number_of_pending_tasks" : 0,
  "number_of_in_flight_fetch" : 0,
  "task_max_waiting_in_queue_millis" : 0,
  "active_shards_percent_as_number" : 100.0
}
As you can see the cluster status is Green, which means everything works as expected.
In Elasticsearch you get Green, Yellow and Red statuses. Yellow would essentially mean that one or more replica shards are in an unassigned state. Red status means that some or all primary shards are unassigned which is really bad.
From this output, we can also see the number of data nodes, primary shards, unassigned shards, etc.
This is a good place to get an overall view of your Elasticsearch cluster’s health.
View the Number of Nodes in your Cluster
By looking at that /_cat/nodes API we can get information about our nodes that is part of our cluster:
$ curl -XGET http://localhost:9200/_cat/nodes?v
ip             heap.percent ram.percent cpu load_1m load_5m load_15m node.role master name
172.31.0.77              10          95   0    0.00    0.00     0.00 mdi       -      es-node-1
172.31.0.45              11          94   0    0.00    0.00     0.00 mdi       -      es-node-2
172.31.0.48              25          96   0    0.07    0.02     0.00 mdi       *      es-node-3
As you can see, we can see information about our nodes such as the JVM Heap, CPU, Load averages, node role of each node, and which node is master.
As we are not running dedicated masters, we can see that node es-node-3 got elected as master.
Create your first Elasticsearch Index
Note that when you create an index, the default primary shards are set to 5 and the default replica shard count is set to 1. You can change the replica shard count after an index has been created, but not the primary shard count as that you will need to set on index creation.
Let’s create an Elasticsearch index named myfirstindex:
$ curl -XPUT http://localhost:9200/myfirstindex
{"acknowledged":true,"shards_acknowledged":true,"index":"myfirstindex"}
Now that your index has been created, let’s have a look at the /_cat/indices API to get information about our indices:
$ curl -XGET http://localhost:9200/_cat/indices?v
health status index        uuid                   pri rep docs.count docs.deleted store.size pri.store.size
green  open   myfirstindex xSX9nOQJQ2qNIq4A6_0bTw   5   1          0            0      1.2kb           650b
From the output you will find that we have 5 primary shards and 1 replica shard, with 0 documents in our index and that our cluster is in a green state, meaning that our primary and replica shards have been assigned to the nodes in our cluster.
Note that a replica shard will NEVER reside on the same node as the primary shard for HA and Redundancy.
Let’s go a bit deeper and have a look at the shards, to see how our shards are distributed through our cluster, using the /_cat/shards API:
$ curl -XGET http://localhost:9200/_cat/shards?v
index        shard prirep state   docs store ip             node
myfirstindex 1     r      STARTED    0  230b 172.31.0.77    es-node-2
myfirstindex 1     p      STARTED    0  230b 172.31.0.48    es-node-3
myfirstindex 4     p      STARTED    0  230b 172.31.0.48    es-node-3
myfirstindex 4     r      STARTED    0  230b 172.31.0.77    es-node-1
myfirstindex 2     r      STARTED    0  230b 172.31.0.45    es-node-2
myfirstindex 2     p      STARTED    0  230b 172.31.0.77    es-node-1
myfirstindex 3     p      STARTED    0  230b 172.31.0.45    es-node-2
myfirstindex 3     r      STARTED    0  230b 172.31.0.48    es-node-3
myfirstindex 0     p      STARTED    0  230b 172.31.0.45    es-node-2
myfirstindex 0     r      STARTED    0  230b 172.31.0.77    es-node-1
As you can see each replica shard of its primary is spread on different nodes.
Replicating a Yellow Cluster Status
For a yellow cluster status, we know that it’s when one or more replica shards are in an unassigned state.
So let’s replicate that behavior by scaling our replica count to 3, which would mean that 5 replica shards will be in an unassigned state:
$ curl -XPUT -H 'Content-Type: application/json' \
http://localhost:9200/myfirstindex/_settings -d \
'{"number_of_replicas": 3}'
Now we have scaled the replica count to 3, but since we only have 3 nodes, we will have a yellow state cluster:
$ curl -XGET http://localhost:9200/_cat/indices?v
health status index        uuid                   pri rep docs.count docs.deleted store.size pri.store.size
yellow open   myfirstindex xSX9nOQJQ2qNIq4A6_0bTw   5   3          0            0      3.3kb           1.1kb
The cluster health status should show the number of unassigned shards, and while they are unassigned we can verify that by looking at the shards API again:
$ curl -XGET http://localhost:9200/_cat/shards?v
index        shard prirep state      docs store ip             node
myfirstindex 1     r      STARTED       0  230b 172.31.0.45    es-node-2
myfirstindex 1     p      STARTED       0  230b 172.31.0.48    es-node-3
myfirstindex 1     r      STARTED       0  230b 172.31.0.77    es-node-1
myfirstindex 1     r      UNASSIGNED
myfirstindex 4     r      STARTED       0  230b 172.31.0.45    es-node-2
myfirstindex 4     p      STARTED       0  230b 172.31.0.48    es-node-3
myfirstindex 4     r      STARTED       0  230b 172.31.0.77    es-node-1
myfirstindex 4     r      UNASSIGNED
myfirstindex 2     r      STARTED       0  230b 172.31.0.45    es-node-2
myfirstindex 2     r      STARTED       0  230b 172.31.0.48    es-node-3
myfirstindex 2     p      STARTED       0  230b 172.31.0.77    es-node-1
myfirstindex 2     r      UNASSIGNED
myfirstindex 3     p      STARTED       0  230b 172.31.0.45    es-node-2
myfirstindex 3     r      STARTED       0  230b 172.31.0.48    es-node-3
myfirstindex 3     r      STARTED       0  230b 172.31.0.77    es-node-1
myfirstindex 3     r      UNASSIGNED
myfirstindex 0     p      STARTED       0  230b 172.31.0.45    es-node-2
myfirstindex 0     r      STARTED       0  230b 172.31.0.48    es-node-3
myfirstindex 0     r      STARTED       0  230b 172.31.0.77    es-node-1
myfirstindex 0     r      UNASSIGNED
At this point in time, we could either add another node to the cluster or scale the replication factor back to 1 to get the cluster health to green again.
I will scale it back down to a replication factor of 1:
$ curl -XPUT http://localhost:9200/myfirstindex/_settings -d '{"number_of_replicas": 1}'
Ingest Data into Elasticsearch
We will ingest 3 documents into our index, this will be a simple document consisting of a name, country and gender, for example:
{
  "name": "james",
  "country": "south africa",
  "gender": "male"
}
First, we will ingest the document using a PUT HTTP method, when using a PUT method, we need to specify the document ID.
PUT methods will be used to create or update a document. For creating:
$ curl -XPUT -H 'Content-Type: application/json' \
http://localhost:9200/myfirstindex/_doc/1 -d '
{"name":"james", "country":"south africa", "gender": "male"}'
Now you will find we have one index in our cluster:
$ curl -XGET http://localhost:9200/_cat/indices?v
health status index        uuid                   pri rep docs.count docs.deleted store.size pri.store.size
green  open   myfirstindex xSX9nOQJQ2qNIq4A6_0bTw   5   1          1            0     11.3kb          5.6kb
Since we know that the document ID is “1”, we can do a GET on the document ID to read the document from the index:
$ curl -XGET http://localhost:9200/myfirstindex/people/1?pretty
{
  "_index" : "myfirstindex",
  "_type" : "people",
  "_id" : "1",
  "found" : false
}
If we ingest documents with a POST request, Elasticsearch generates the document ID for us automatically. Let’s create 2 documents:
$ curl -XPOST -H 'Content-Type: application/json' \
http://localhost:9200/myfirstindex/_doc/ -d '
{"name": "kevin", "country": "new zealand", "gender": "male"}'

$ curl -XPOST -H 'Content-Type: application/json' \
http://localhost:9200/myfirstindex/_doc/ -d '
{"name": "sarah", "country": "ireland", "gender": "female"}'
When we have a look again at our index, we can see that we now have 3 documents in our index:
$ curl -XGET http://localhost:9200/_cat/indices?v
health status index        uuid                   pri rep docs.count docs.deleted store.size pri.store.size
green  open   myfirstindex xSX9nOQJQ2qNIq4A6_0bTw   5   1          3            0       29kb         14.5kb
Search Queries
Now that we have 3 documents in our elasticsearch index, let’s explore the search APIs to get data from our index. First, let’s search for the keyword “sarah” as a source query parameter:
$ curl -XGET 'http://localhost:9200/myfirstindex/_search?q=sarah&pretty'
{
  "took" : 9,
  "timed_out" : false,
  "_shards" : {
    "total" : 5,
    "successful" : 5,
    "skipped" : 0,
    "failed" : 0
  },
  "hits" : {
    "total" : 1,
    "max_score" : 0.2876821,
    "hits" : [
      {
        "_index" : "myfirstindex",
        "_type" : "_doc",
        "_id" : "cvU96GsBP0-G8XdN24s4",
        "_score" : 0.2876821,
        "_source" : {
          "name" : "sarah",
          "country" : "ireland",
          "gender" : "female"
        }
      }
    ]
  }
}
We can also narrow our search query down to a specific field, for example, show me all the documents with the name kevin:
$ curl -XGET 'http://localhost:9200/myfirstindex/_search?q=name:kevin&pretty'
{
...
  "hits" : {
    "total" : 1,
    "max_score" : 0.2876821,
    "hits" : [
      {
        "_index" : "myfirstindex",
        "_type" : "_doc",
        "_id" : "gPU96GsBP0-G8XdNHoru",
        "_score" : 0.2876821,
        "_source" : {
          "name" : "kevin",
          "country" : "new zealand",
          "gender" : "male"
        }
      }
    ]
  }
}
With Elasticsearch we can also search with our query in the request body, a similar query as above would look like this:
$ curl -XPOST -H 'Content-Type: application/json' \
'http://localhost:9200/myfirstindex/_search?pretty' -d '
{
  "query": {
    "match": {
      "name": "kevin"
    }
  }
}'

{
...
        "_index" : "myfirstindex",
        "_source" : {
          "name" : "kevin",
          "country" : "new zealand",
          "gender" : "male"
        }
...
}
We can use wildcard queries:
$ curl -XPOST -H 'Content-Type: application/json' \
'http://172.31.0.77:9200/myfirstindex/_search?pretty' -d '
{
  "query": {
    "wildcard": {
      "country": "*land"
    }
  }
}'

{
...
    "hits" : [
      {
        "_index" : "myfirstindex",
        "_type" : "_doc",
        "_id" : "cvU96GsBP0-G8XdN24s4",
        "_score" : 1.0,
        "_source" : {
          "name" : "sarah",
          "country" : "ireland",
          "gender" : "female"
        }
      },
      {
        "_index" : "myfirstindex",
        "_type" : "_doc",
        "_id" : "gPU96GsBP0-G8XdNHoru",
        "_score" : 1.0,
        "_source" : {
          "name" : "kevin",
          "country" : "new zealand",
          "gender" : "male"
        }
      }
    ]
...
}
Have a look at their documentation for more information on the Search API
Delete your Index
To wrap this up, we will go ahead and delete our index:
$ curl -XDELETE http://localhost:9200/myfirstindex
Going Further
If this got you curious, then definitely have a look at this Elasticsearch Cheatsheet that I’ve put together and if you want to generate lots of data to ingest to your elasticsearch cluster, have a look at this python script.
Our other links related to ELK:
- How To Install Logstash on Ubuntu and Debian
- Monitoring Linux logs using Kibana and rsyslog