How To Add a User to Sudoers On Debian 10 Buster

In today’s tutorial, we are going to see how you can add a user to sudoers on Debian distributions.

The sudo command allows authorized users to perform commands as another user, which is by default the root user.

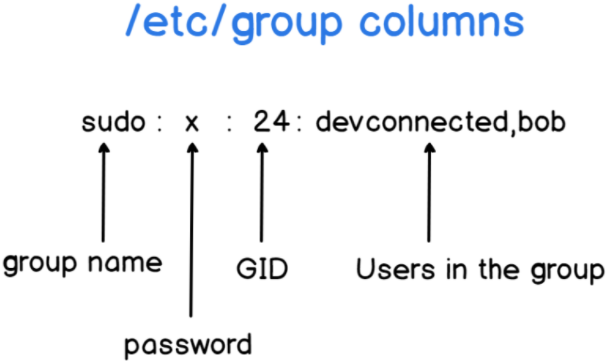
There are two ways to add a user to sudoers : you can add this user to the sudo group or you can add this user to the sudoers file located at etc.

Here are the details of the two methods.

I – Adding an existing user to the sudo group

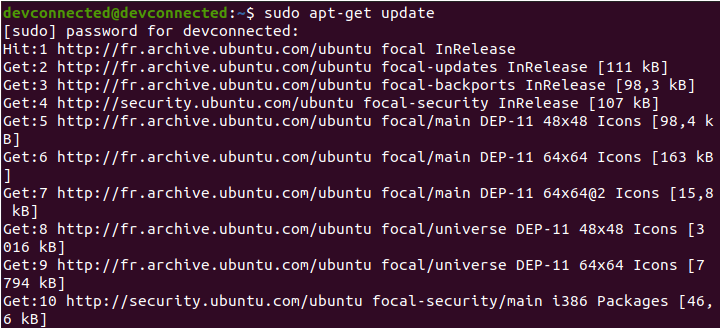
As a prerequisites, make sure that the sudo command is available by default. If it’s not the case, you can install it by running (with an account with admin rights)

$ apt-get update
$ apt-get install sudo

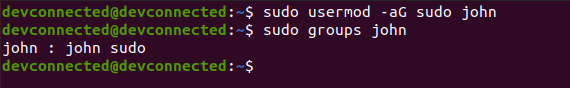
The first method is to add the user to the sudo group.

To do that, you are going to use the “usermod” command with the capital G flag (for groups)

$ sudo usermod -a -G sudo user

You can also use the gpasswd command to grand sudo rights.

$ sudo gpasswd -a bob sudo
Adding user to the group sudo

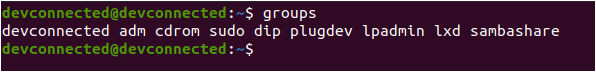
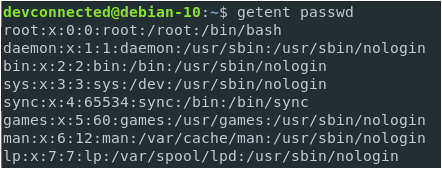
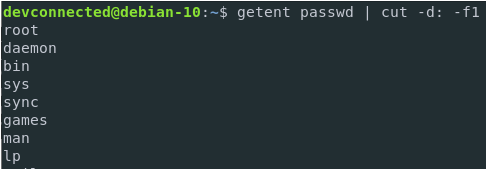
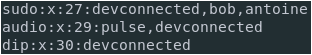
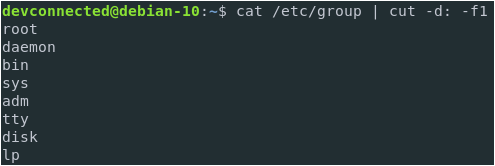
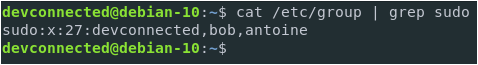
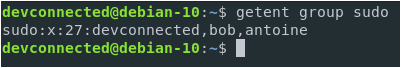
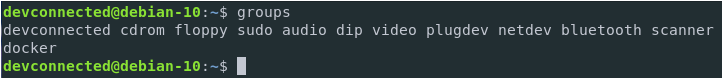
Make sure that the user belongs to the sudo group with the groups command.

$ su - user
(password for user)

$ groups
user sudo

You should now be able to perform a sudo request on Debian 10.

Depending on the configuration you chose during your Debian 10 installation process, you may or may not have access to a root account. If you chose a password for your root account, you will be able to connect to it. Otherwise, the default admin account is the one you created during the installation process.

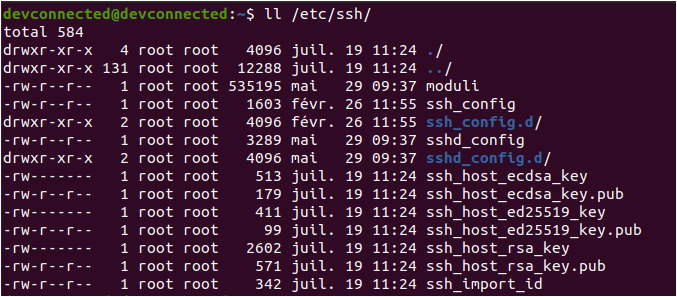
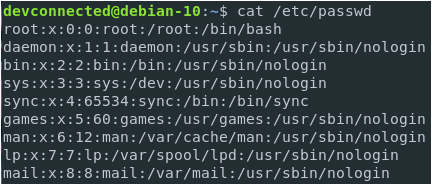
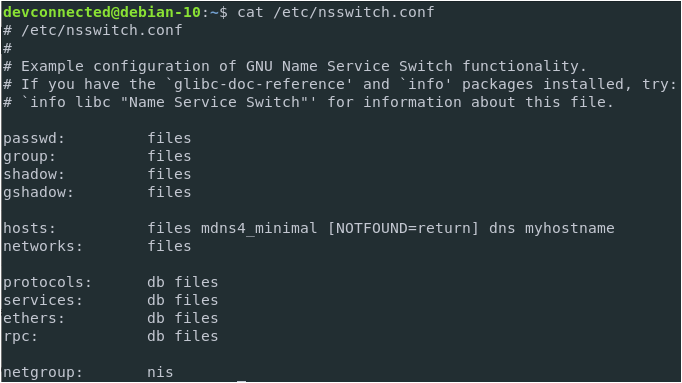
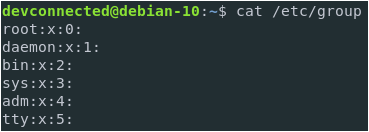
The sudoers file is located at /etc/sudoers.

This file contains a set of rules that are applied to determine who has sudo rights on a system, which commands they can execute with sudo privileges, and if they should be prompted a password or not.

However, you should never modify the sudoers file with a text editor.

Saving a bad sudoers may leave you with the impossibility of getting sudo rights ever again.

Instead, you are going to use visudo, a tool designed to make sure you don’t do any mistakes.

$ sudo visudo

This is what you should see.

II – Adding an existing user to the sudoers file visudo

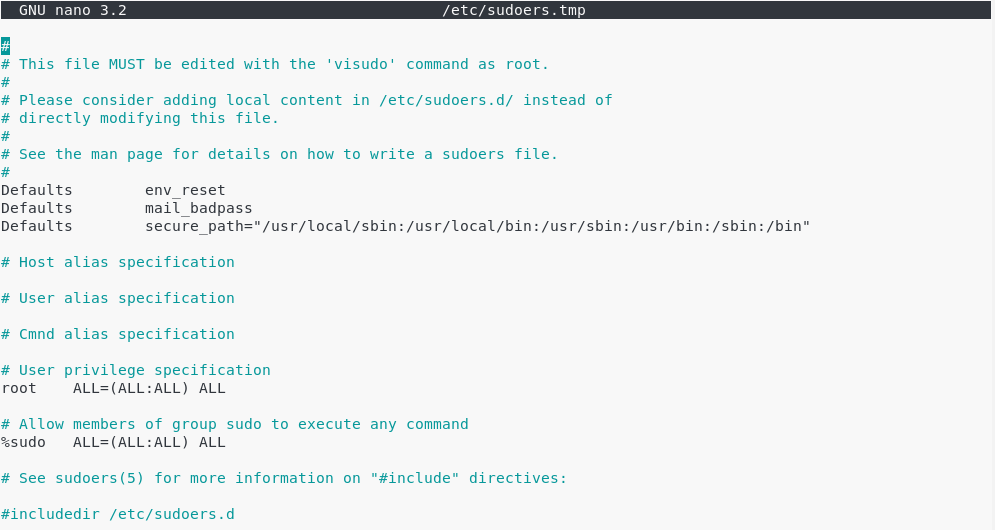
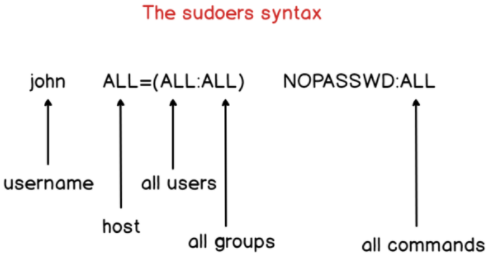
At the end of the file, add a new line for the user.

john       ALL=(ALL:ALL) ALL

II – Adding an existing user to the sudoers file sudoers-syntax

By default, the account password will be asked every five minutes to perform sudo operations.

However, if you want to remove this password verification, you can set the NOPASSWD option.

john       ALL=(ALL:ALL) NOPASSWD:ALL

If you want the password verification to be skipped for longer periods of time, you can overwrite the timestamp_timeout (in minutes) parameter in your sudoers file.

# /etc/sudoers
#
# This file MUST be edited with the 'visudo' command as root.
#
# See the man page for details on how to write a sudoers file.
#

Defaults        env_reset
Defaults        mail_badpass
Defaults        secure_path = /sbin:/bin:/usr/sbin:/usr/bin
Defaults        timestamp_timeout=30

III – Adding a group to the sudoers file

Via the visudo, you can add an entire group to the sudoers.

This might be handy if you have a group for system administrators for example. In this case, you simply have to add a user to the system administrators group for him/her to be granted sudo privileges.

To add a group to the sudoers file, simply add a percent symbol at the beginning of the file.

%sysadmins       ALL=(ALL:ALL) NOPASSWD:ALL

Make sure that your user is part of the designed group with the groups command.

$ su - user
$ groups
user sysadmins

You can test your new sudo rights by changing your password for example

$ sudo passwd

IV – Most Common Errors

  • user is not in the sudoers file. This incident will be reported.

IV – Most Common Errors not-in-sudoers

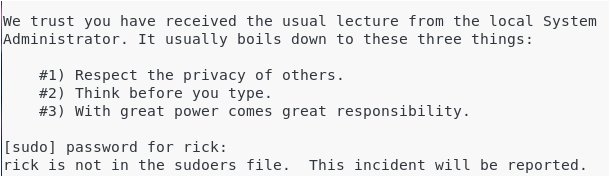
This is the standard error message you get when a user does not belong to the sudo group on Debian 10.

By adding this user to the sudoers file on Debian, this error message should not be raised anymore.

How To Install and Enable SSH Server on Ubuntu 20.04

This tutorial focuses on setting up and configuring an SSH server on a Ubuntu 20.04 desktop environment.

As a system administrator, you are probably working with SSH on a regular basis.

Short for Secure Shell, SSH is a network protocol used in order to operate remote logins and commands on machines over local or remote networks.

SSH comes as an evolution to the Telnet protocol: as its name describes it, SSH is secure and encrypts data that is transmitted over the network.

As a power user, you may want to onboard new machines with SSH servers in order to connect to them later on.

In this tutorial, we are going to see how you can install and enable SSH on Ubuntu 20.04 distributions.

We are also going to see how you can install OpenSSH on your fresh Ubuntu distribution.

Prerequisites

In order to install a SSH server on Ubuntu 20.04, you need to have sudo privileges on your server.

Note : there are no practical differences between adding a user to sudoers on Ubuntu and Debian.

To check whether you have sudo privileges or not, you can launch the following command.

sudo -l

If you see the following lines on your terminal, it means that you currently belongs to the sudo group.

User user may run the following commands on server-ubuntu:
    (ALL : ALL) ALL

Alternatively, you can run the “groups” command and verify that “sudo” is one of the entries.

groups

How To Install and Enable SSH Server on Ubuntu groups

By default, SSH should already be installed on your host, even for minimal configurations.

To check that this is actually the case, you can run the “ssh” command with the “-V” option.

ssh -V

Adding a user to administrators-add-user-sudo

As you can see, I am currently running OpenSSH 8.2 on Ubuntu with the OpenSSL 1.1.1 version (dated from the 31th of March 2020).

Be careful : this information does not mean that you have a SSH server running on your server, it only means that you are currently able to connect as a client to SSH servers.

Now that all prerequisites are met, let’s see how you can install an OpenSSH server on your host.

Installing OpenSSH Server on Ubuntu 20.04

First of all, as always, make sure that your current packages are up to date for security purposes.

sudo apt-get update

Installing OpenSSH Server on Ubuntu 20.04 apt-get-update

Now that all packages are up-to-date, run the “apt-get install” command in order to install OpenSSH.

sudo apt-get install openssh-server

This command should run a complete installation of an OpenSSH server.

From steps displayed on your console, you should see the following details :

  • A configuration file is created in the /etc/ssh folder named sshd_config;
  • Symbolic links are created : one named sshd.service (your systemd service) and one in the multi-user target (to boot SSH when you log in).

As stated earlier, a SSH service was created and you can check that it is actually up and running.

sudo systemctl status sshd

Installing OpenSSH Server on Ubuntu 20.04 sshd-service

By default, your SSH server is listening on port 22 (which is the default SSH port).

If you want to go into further details, you can actually check that the SSH server is listening on port 22 with the netstat command.

netstat -tulpn | grep 22^

(if you don't have netstat by default)
sudo apt-get install net-tools

Installing OpenSSH Server on Ubuntu 20.04 netstat

Awesome!

Your SSH server is now up and running on your Ubuntu 20.04 host.

Enabling SSH traffic on your firewall settings

If you are using UFW as a default firewall on your Ubuntu 20.04 host, it is likely that you need to allow SSH connections on your host.

To enable SSH connections on your host, run the following command

sudo ufw allow ssh

Enabling SSH traffic on your firewall settings ufw-allow

If you are not sure if you are actively using the UFW firewall, you can run the “ufw status” command.

sudo ufw status

Enabling SSH traffic on your firewall settings ufw-status

Enable SSH server on system boot

As you probably saw, your SSH server is now running as a service on your host.

It is also very likely that it is instructed to start at boot time.

To check whether your service is enable or not, you can run the following command

sudo systemctl list-unit-files | grep enabled | grep ssh

If you have no results on your terminal, you should “enable” the service in order for it to be launched at boot time.

sudo systemctl enable ssh

Important note : this is not a typo, we are actually enabling the SSH service even if we are referring to the sshd service.

Enable SSH server on system boot ssh-service-enable

If you look for the sshd.service file, you will actually realize that this is a linked unit file.

Enable SSH server on system boot linked-ssh-unit-file

As a consequence, you can’t directly enable the sshd service, but you have to enable the ssh one.

Configuring your SSH server on Ubuntu 20.04

Before giving any access to your users, it is important for your SSH server to be correctly configured.

If it is done badly, you are at risk when it comes to SSH attackes and your entire infrastructure can be compromised easily.

By default, SSH configuration files are located in the /etc/ssh folder.

Configuring your SSH server on Ubuntu ssh-folder-configuration

In this directory, you are going to find many different files and folders, but the most important ones are :

  • ssh_config : is used in order to configure SSH clients. It means that it defines rules that are applied everytime you use SSH to connect to a remote host or to transfer files between hosts;
  • sshd_config : is used in order to configure your SSH server. It is used for example to define the reachable SSH port or to deny specific users from communicating with your server.

In this tutorial, we are going to focus on the server part of the configuration, but you can tell a look at the other files if you are curious about them.

Changing SSH default port

The first step towards running a secure SSH server is to change the default assigned by the OpenSSH server.

Edit your sshd_config configuration file and look for the following line.

#Port 22

Changing SSH default port-2222

Make sure to change your port to one that is not reserved for other protocols. I will choose 2222 in this case.

Be careful when you change your default SSH port, you will have to specify it when connecting to it.

Disabling Root Login on your SSH server

By default, on recent distributions, root login is set to “prohibit-password”.

This option means that all interactive authentication methods are banned, allowing only public keys to be used.

In short, you need to setup SSH keys and to use them in order to connect as root.

However, even if we connect without a password, root login is not recommended : if keys are compromised, your entire host is compromised.

As a consequence, you can set this option to “no” in order to restrict it completely.

#PermitRootLogin

PermitRootLogin no

Disabling Root Login on your SSH server

Restarting your SSH server to apply changes

In order for the changes to be applied, you need to restart your SSH server.

sudo systemctl restart sshd

sudo systemctl status sshd

Restarting your SSH server to apply changes ssh-server-restart

When restarting it, make sure that the server is correctly listening on the custom port your specified earlier.

This information is available on the last lines of the systemd status command.

You can also use the “netstat” command as we already did in the previous sections.

netstat -tulpn | grep 2222

Connecting to your SSH server

In order to connect to your SSH server, you are going to use the ssh command with the following syntax

$ ssh -p <port> <username>@<ip_address>

If you are connecting over a LAN network, make sure to get the local IP address of your machine with the following command

$ sudo ifconfig

Connecting to your SSH server local-host

For example, in order to connect to my own instance located at 127.0.0.1, I would run the following command

$ ssh -p 2222 <user>@127.0.0.1

You will be asked to provide your password and to certify that the authenticity of the server is correct.

Connecting to your SSH server connect-ssh

Exiting your SSH server

In order to exit from your SSH server on Ubuntu 20.04, you can hit Ctrl + D or type ‘logout’ and your connection will be terminated.
Exiting your SSH server logout-ssh 1

Disabling your SSH server

In order to disable your SSH server on Ubuntu 20.04, run the following command

sudo systemctl stop sshd

sudo systemctl status sshd

Disabling your SSH server stop-ssh-service

From there, your SSH server won’t be accessible anymore.

Conclusion

In this tutorial, you learnt how you can install, enable, configure and restart your SSH server on Ubuntu 20.04

With this tutorial, you also learnt how you can configure your SSH server in order for it to be robust enough for basic attacks.

If you are interested in Linux system administration, we encourage you to have a look at our other tutorials on the subject.

How to Setup Grafana and Prometheus on Linux

In today’s tutorial, we are going to take a look at one of the most popular monitoring stacks : Grafana and Prometheus.

Prometheus is a time series database, created in 2012 and part of the Cloud Native Computing Foundation, that exposes dozens of exporters for you to monitor anything.

On the other hand, Grafana is probably one of the most popular monitoring tools.

In Grafana, you create dashboards that bind to datasources (such as Prometheus) in order to visualize your metrics in near real-time.

Grafana & Prometheus natively bind together, so today we are going to see how you can setup Prometheus and Grafana on your Linux system.

This tutorial works for the latest versions of Ubuntu (19.04) and Debian (10 Buster).

Ready?

I – What You Will Learn

By following this tutorial, you are going to learn about the following concepts:

  • Installing a Prometheus server on your Linux server.
  • How to configure authentication and encryption on Prometheus with a reverse proxy
  • How to install and configure Grafana for Prometheus
  • How to install your first exporter in Prometheus to monitor Linux system metrics.
  • How to import your first monitoring dashboard on Grafana

II – Installing Prometheus on Ubuntu and Debian

First, we are going to see how you can install the latest version of Prometheus and configure it for your Linux server.

a – Download Prometheus

First, head over to the Prometheus downloads page.

Make sure to filter for your operating system and your CPU architecture (in my case Linux and amd64)

a – Download Prometheus prometheus-downloads-page

Make sure to select the latest stable version, and not the “rc” one, as it is not considered stable enough for now.

Download the archive on your system by clicking on the archive, or by running a wget command if you are using the Terminal.

$ wget https://github.com/prometheus/prometheus/releases/download/v2.11.2/prometheus-2.11.2.linux-amd64.tar.gz

You should now have the tar.gz file on your system.

Untar it to extract the files in the archive.

$ tar xvzf prometheus-2.11.2.linux-amd64.tar.gz

a – Download Prometheus tar-xvzf-prom

The archive contains many important files, but here is the main ones you need to know.

  • prometheus.yml: the configuration file for Prometheus. This is the file that you are going to modify in order to tweak your Prometheus server, for example to change the scraping interval or to configure custom alerts;
  • prometheus: the binary for your Prometheus server. This is the command that you are going to execute to launch a Prometheus instance on your Linux box;
  • promtool: this is a command that you can run to verify your Prometheus configuration.

We are not going to execute directly the Prometheus, instead we are going to configure it as a service.

It will bring more robustness and reliability in case our Prometheus server were to stop suddenly.

b – Configuring Prometheus as a service

First of all, for security purposes, you are going to create a Prometheus user with a Prometheus group.

$ sudo useradd -rs /bin/false prometheus

Make sure to move the binaries to your local bin directory.

I stored my binaries in a Prometheus folder, located on my home directory.

Here’s the command to move them to the bin directory.

$ cd Prometheus/prometheus-2.11.2.linux-amd64/ 
$ sudo cp prometheus promtool /usr/local/bin

Give permissions to the Prometheus user for the prometheus binary.

$ sudo chown prometheus:prometheus /usr/local/bin/prometheus

Create a folder in the /etc folder for Prometheus and move the console files, console libraries and the prometheus configuration file to this newly created folder.

$ sudo mkdir /etc/prometheus
$ sudo cp -R consoles/ console_libraries/ prometheus.yml /etc/prometheus

Create a data folder at the root directory, with a prometheus folder inside.

$ sudo mkdir -p data/prometheus

Give the correct permissions to those folders recursively.

$ sudo chown -R prometheus:prometheus data/prometheus /etc/prometheus/*
Great!

You are now set to create a Prometheus service.

Head over to the /lib/systemd/system folder and create a new file named prometheus.service

$ cd /lib/systemd/system
$ sudo touch prometheus.service

In order to see the different launch options for Prometheus, you can run the prometheus command with a h flag.

b – Configuring Prometheus as a service

$ prometheus -h
usage: prometheus [<flags>]

The Prometheus monitoring server

Flags:
  -h, --help                     Show context-sensitive help (also try --help-long and
                                 --help-man).
      --version                  Show application version.
      --config.file="prometheus.yml"
                                 Prometheus configuration file path.
      --web.listen-address="0.0.0.0:9090"

Edit the newly created file, and paste the following content inside.

b – Configuring Prometheus as a service 1

$ sudo nano prometheus.service

[Unit]
Description=Prometheus
Wants=network-online.target
After=network-online.target

[Service]
Type=simple
User=prometheus
Group=prometheus
ExecStart=/usr/local/bin/prometheus \
  --config.file=/etc/prometheus/prometheus.yml \
  --storage.tsdb.path="/data/prometheus" \
  --web.console.templates=/etc/prometheus/consoles \
  --web.console.libraries=/etc/prometheus/console_libraries \
  --web.listen-address=0.0.0.0:9090 \
  --web.enable-admin-api

Restart=always

[Install]
WantedBy=multi-user.target

Save your file, enable your service at startup, and start your service.

$ sudo systemctl enable prometheus
$ sudo systemctl start prometheus<

b – Configuring Prometheus as a service prometheus-start

Now that we have our Prometheus server running, let’s connect to the Web UI to make sure that everything is okay.

Unless you modified it in the service file, your Prometheus server should be running at http://localhost:9090.

By default, this is what you should see on your screen.

prometheus-target

By default, Prometheus should start monitoring itself.

Click on Status, then Targets in top bar menu, and verify that you have one target : the Prometheus server itself.

prometheus-target-2

Great! The state is “UP” for the Prometheus target. Everything is running smoothly.

Now that our Prometheus server is running, it is time to configure a reverse proxy for authentication and encryption.

III – Setting up a reverse proxy for Prometheus

Prometheus does not natively support authentication or TLS encryption.

If you are running Prometheus locally, it doesn’t not matter that much.

But if you were to expose Prometheus endpoints to the outside world, you would want to setup a strong authentication for users to check Prometheus.

For this tutorial, I will be using NGINX as a reverse proxy, but there are many other proxies out there that you can choose from.

a – Install NGINX on Debian 10

The steps are pretty much the same for Ubuntu 18.04/19.04.

Simply install nginx by downloading it from the apt sources.

$ sudo apt update
$ sudo apt-get install nginx

This should create a nginx service on your server, and it should be started by default.

a – Install NGINX on Debian 10

$ sudo systemctl status nginx
● nginx.service - A high performance web server and a reverse proxy server
   Loaded: loaded (/lib/systemd/system/nginx.service; enabled; vendor preset: enabled)
   Active: active (running) since Fri 2019-07-05 06:01:12 UTC; 1 months 10 days ago
     Docs: man:nginx(8)
 Main PID: 15792 (nginx)
    Tasks: 3 (limit: 4704)
   CGroup: /system.slice/nginx.service
           ├─15792 nginx: master process /usr/sbin/nginx -g daemon on; master_process on;

By default, NGINX will start listening for HTTP requests in the default http port, which is 80.

If you are not sure about the port used by NGINX, run the following command.

The last column will tell you the port used by NGINX.

$ sudo lsof | grep LISTEN | grep nginx
nginx     15792     root    8u     IPv4         1140223421       0t0        TCP *:http (LISTEN)
Great! Let’s do a quick browser check to see the default HTTP page distributed by NGINX.

nginx-default-page

b – Configuring NGINX as a reverse proxy

In this case, we are not interested in using NGINX as a standard web server.

Instead, we want to use NGINX as a reverse proxy.

As a reminder, a reverse proxy is an entity that proxies requests to other entities given a set of internal rules defined in the proxy configuration.

reverse-proxy

By default, the NGINX configuration file is located at /etc/nginx/nginx.conf.

In this file, you have to make sure that it includes virtual hosts included in the conf.d directory.

$ cat /etc/nginx/nginx.conf

##
# Virtual Host Configs
##

include /etc/nginx/conf.d/*.conf;
include /etc/nginx/sites-enabled/*;

The conf.d directory is where we are going to create our reverse proxy configuration file for Prometheus.

Create a new file in this directory called prometheus.conf, and start editing the file.

$ cd conf.d/
$ sudo touch prometheus.conf

Paste the following configuration in your configuration file.

server {
    listen 1234;

    location / {
      proxy_pass           http://localhost:9090/;
    }
}

Restart your NGINX server, and browse to http://localhost:1234.

$ sudo systemctl restart nginx
(if you have any errors)
$ sudo journalctl -f -u nginx.service

proxying-prometheus

Great!
Prometheus is now sitting behind a reverse proxy.

c – Changing Prometheus configuration for reverse proxying

Now that Prometheus is accessed by a reverse proxy, we need to change the configuration of Prometheus for it to bind to the reverse proxy. Head over to /lib/systemd/system and change your service configuration file.

c – Changing Prometheus configuration for reverse proxying

$ cd /lib/systemd/system 
$ sudo nano prometheus.service

ExecStart=/usr/local/bin/prometheus \
  --config.file=/etc/prometheus/prometheus.yml \
  --storage.tsdb.path="/data/prometheus" \
  --web.console.templates=/etc/prometheus/consoles \
  --web.console.libraries=/etc/prometheus/console_libraries \
  --web.listen-address=0.0.0.0:9090 \
  --web.enable-admin-api \
  --web.external-url=https://localhost:1234

Restart your service, and make sure that your server is up and running correctly.

$ sudo systemctl daemon-reload
$ sudo systemctl restart prometheus
$ journalctl -f -u prometheus.service
Awesome!

Make sure that Prometheus is still reachable at http://localhost:1234.

d – Enable reverse proxy authentication

Before moving on with the reverse proxy, let’s have a quick look at how you can set up credentials for your Prometheus instance.

Prometheus does not handle built-in authentication, so we are going to rely on reverse proxy authentication for this.

Create a password file in the Prometheus configuration folder.

If you don’t have the htpasswd executable on your system, make sure to install it first.

$ sudo apt-get install apache2-utils
$ cd /etc/prometheus
$ sudo htpasswd -c .credentials admin

Choose a strong password, and make sure that the pass file was correctly created.

d – Enable reverse proxy authentication htpasswd-file

Now, it is time to import it into your NGINX configuration file.

Head over to /etc/nginx/conf.d and change your server configuration by adding your credentials.

d – Enable reverse proxy authentication

$ cd /etc/nginx/conf.d

server {
    listen 1234;

    location / {
      auth_basic           "Prometheus";
      auth_basic_user_file /etc/prometheus/.credentials;
      proxy_pass           http://localhost:9090/;
    }
}

Save your file, and restart NGINX

$ sudo systemctl restart nginx
$ journalctl -f -u nginx.service

If everything is okay, go to http://localhost:1234 and you should be prompted with user credentials.

d – Enable reverse proxy authentication auth-required

Provide the correct credentials, and you should be good to go!

e – Enabling HTTPS on the reverse proxy<

For the last chapter, we are going to enable the TLS protocol on our NGINX instance.

Using HTTPS will encrypt requests done to the server, but most importantly it will encrypt the server responses containing all the metrics.

Creating keys for Prometheus

For this chapter, we are going to use self-signed certificates.

However, if you have a certificate authority, you can issue a certificate request to them.

You will need the certtool in order to create certificates on your Linux instance.

Install the gnutls related packages (utils for Ubuntu and bin for Debian based distributions)

(Ubuntu)
$ sudo apt-get install gnutls-utils

(Debian)
$ sudo apt-get install gnutls-bin

Create a new directory in /etc/ssl in order to store your Prometheus keys.

$ cd /etc/ssl
$ sudo mkdir prometheus

Go into the prometheus directory, and start by generating a private key for Prometheus.

$ sudo certtool --generate-privkey --outfile prometheus-private-key.pem

Now that you have a private key, let’s generate a certificate (or a public key) for Prometheus.

$ sudo certtool --generate-self-signed --load-privkey prometheus-private-key.pem --outfile prometheus-cert.pem
  # The certificate will expire in (days): 3650
  # Does the certificate belong to an authority? (Y/N): y
  # Will the certificate be used to sign other certificates? (Y/N): y
  # Will the certificate be used to sign CRLs? (y/N): y
Great!

You now have two keys sitting in your /etc/ssl/prometheus.

Configuring HTTPS on NGINX

Now that our keys are created, it is time to import them into our NGINX configuration.

Go back to your /etc/nginx/conf.d directory, and edit your prometheus.conf file.

Configuring HTTPS on NGINX

$ cd /etc/nginx/conf.d
$ sudo nano prometheus.conf

server {
    listen 1234 ssl;
    ssl_certificate /etc/ssl/prometheus/prometheus-cert.pem;
    ssl_certificate_key /etc/ssl/prometheus/prometheus-private-key.pem;

    location / {
      auth_basic           "Prometheus";
      auth_basic_user_file /etc/prometheus/.credentials;
      proxy_pass           http://localhost:9090/;
    }
}

Again, restart your NGINX server, and your virtual host should now be switched to HTTPS.

$ sudo systemctl restart nginx
$ sudo journalctl -f -u nginx.service

Verify that Prometheus is now delivered via HTTPS

We are going to use cURL in order to verify that Prometheus is now served via HTTPS.

If you don’t own cURL on your instance, make sure to install it first.

$ sudo apt-get update
$ sudo apt-get install curl

$ curl -u admin -k https://localhost:1234/metrics
Enter host password for user admin:

From there, this is what you should see on your screen.

Configuring HTTPS on NGINX prometheus-https

Great! We are now ready to install Grafana to visualize Prometheus metrics.

IV – Installing Grafana

The Grafana installation was already covered extensively in our of our previous articles, so make sure to read it to setup your Grafana server.

a – Configure Prometheus as a Grafana datasource

First, head to the datasources panel by clicking on Configuration > Data sources via the left menu.

IV – Installing Grafana datasources-grafana

Click on “Add a datasource”

add-data-source-1

Select a Prometheus data source on the next window.

prometheus-datasource

Here is the configuration for Prometheus. Make sure to skip the TLS verification as you are using a self-signed certificate.

prometheus-config

Click on “Save and Test” at the bottom of your configuration window, and make sure that your data source is working properly.

data-source-is-working-1

V – Installing the Node Exporter to monitor Linux metrics

Now that your Prometheus data source is working, it is time to install your first exporter.

As a reminder, exporters are standalone entities that regularly aggregate metrics for a wide variety of targets : operating systems, databases, websites.

If you feel like you are missing some of the concepts about Prometheus, here’s a guide to understand them.

The Node Exporter is an exporter that gathers metrics abour your Linux system : the CPU usage, the memory usage as well as various statistics on your filesystems.

a – Downloading the Node Exporter

First of all, we are going to download the Node exporter on our system.

Head over to https://prometheus.io/download/ and select Linux operating systems for amd64 CPU architectures.

Scroll down, and find the section dedicated to the node exporter.

node-exporter-prometheus

Simply click on it, or copy the link and run a wget command.

$ wget https://github.com/prometheus/node_exporter/releases/download/v0.18.1/node_exporter-0.18.1.linux-amd64.tar.gz

Extract the archive to access the files inside it.

$ tar xvzf node_exporter-0.18.1.linux-amd64.tar.gz

Inside your newly created directory, you should now see the node_exporter binary ready for use.

Again, move this executable to your /usr/local/bin folder.

$ cd node_exporter-0.18.1.linux-amd64/
$ sudo cp node_exporter /usr/local/bin

Create a new user for the node exporter, and change the permissions for the node exporter binary.

$ sudo useradd -rs /bin/false node_exporter
$ sudo chown node_exporter:node_exporter /usr/local/bin/node_exporter

b – Create a Node Exporter service

Again, we are going to run the node exporter as a service.

Go to the /lib/systemd/system folder and create a new file named node_exporter.service

$ cd /lib/systemd/system
$ sudo touch node_exporter.service

Paste the following content in your node exporter service.

By default, a lot of modules (cpu, mem, disk) are already enabled by default, so we only need to enable a few more.

b – Create a Node Exporter service

[Unit]
Description=Node Exporter
Wants=network-online.target
After=network-online.target

[Service]
Type=simple
User=node_exporter
Group=node_exporter
ExecStart=/usr/local/bin/node_exporter \
    --collector.mountstats \
    --collector.logind \
    --collector.processes \
    --collector.ntp \
    --collector.systemd \
    --collector.tcpstat \
    --collector.wifi

Restart=always

[Install]
WantedBy=multi-user.target

When you are done, enable your service, and start it.

$ sudo systemctl daemon-reload
$ sudo systemctl enable node_exporter
$ sudo systemctl start node_exporter

(Make sure that everything is running smoothly)
$ sudo journalctl -f -u node_exporter.service

c – Configure the Node Exporter as a Prometheus target

Now that the node exporter is up and running, we need to tell Prometheus to scrape it periodically.

To do that, go to your Prometheus configuration file located at /etc/prometheus/prometheus.yml.

$ cd /etc/prometheus
$ sudo nano prometheus.yml

In the static_configs part of your configuration file, add a new entry for the node exporter.

static_configs:
            - targets: ['localhost:9090', 'localhost:9100']

Restart Prometheus for your changes to be applied.

$ sudo systemctl restart prometheus

Head over to https://localhost:1234/targets and make sure that your target is correctly scraped.

c – Configure the Node Exporter as a Prometheus target targets-prom

Great! Prometheus is now scraping metrics from the Node Exporter.

VI – Building a Grafana dashboard to monitor Linux metrics

The last step will be to import a Grafana dashboard that reflects the metrics that we are gathering with Prometheus.

The “Node Exporter Full” dashboard created by idealista seems to be a great candidate.

Looking to create your own Grafana dashboard using the UI or the API? Follow the guide!

a – Importing a Prometheus dashboard into Grafana

We don’t have to design the entire dashboard by ourselves, we can import idealista’s dashboard right into our Grafana server.

To do so, click on “Import” by hovering the “Plus” icon, and clicking on “Import.

import-grafana-dashboard

On the next window, simply enter the dashboard ID in the corresponding field (1860 in our case)

dashboard-id

The dashboard should be automatically detected by Grafana.

On the next window, select your Prometheus data source, and click on Import.

import-dashboard-2

You are done! Your dashboard is now up and running.

a – Importing a Prometheus dashboard into Grafana

(If you are not seeing metrics right away, make sure to tweak the time parameter located at the top right corner of the dashboard)

So, where should you go from there?

The possibilities are endless.

You can start by adding more exporters to your Prometheus instance.

The full list of Prometheus exporters is available here.

Also, if you are looking for examples for MongoDB and MySQL, I wrote some tutorials about those specific exporters.

If you are looking to continue with the Node exporter, there is a complete guide about it in the monitoring section.

I hope that you learned something new today.

Until then, have fun, as always.

How To List Users and Groups on Linux

On Linux, as a system administrator, you often want to have a complete list of all the users and all the groups on your host.

It is quite crucial for security purposes to make sure that you have the correct amount of users and that you didn’t forget to delete some.

There are several ways to list users and groups on Linux.

First, you can read the passwd and the group file on your system, with cut commands to extract useful information.

A more effective way is to use the getent command that relies on the Name Service Switch, a Unix-based facility to define custom databases on your host.

Here is how you can list users and groups on Linux.

List Users on Linux

In order to list users on Linux, you have to execute the “cat” command on the “/etc/passwd” file. When executing this command, you will be presented with the list of users currently available on your system.

Alternatively, you can use the “less” or the “more” command in order to navigate within the username list.

$ cat /etc/passwd

$ less /etc/passwd

$ more /etc/passwd

You will be presented with a list of users currently available on your system.

Note : it does not mean that users are connected right now!

List Users on Linux etc-passwd

But what do the columns of the passwd file even mean?

list-users-linux

As a quick side note, an “x” in the password column means that the password is encrypted and it is to be found in the /etc/shadow file.

Now that you know how to list users on your Linux host, let’s see how you can effectively isolate a list of usernames.

List Usernames using the /etc/passwd file

As you probably noticed, the /etc/passwd file is made of lines separated by colons.

a – List Usernames using cut

In order to list usernames on Linux, use the “cat” command and pipe it to the “cut” command in order to isolate usernames available in the first column of your file.

To achieve that, run the following command

$ cat /etc/passwd | cut -d: -f1

First, you are printing a list of all records in the passwd file. Next, those results are piped (using Linux pipes and redirection) to the cut command.

The cut command defines a custom separator (with the d option) that is equal to the colon character.

Finally, we are isolating the first field of the results we are getting. In this case, this is equal to the usernames as defined by our schema on the passwd columns.

a – List Usernames using cut cut-options

b – List Usernames using awk

In order to list usernames on Linux, you can also use the “cat” command piped with the “awk” command that is similar to the “cut” command that we have seen before.

As a reminder, the awk command (or mawk) is an interpreter for the AWK programming language.

AWK is a programming language designed to ease data extract and manipulation for data streams.

It is widely used on Unix-based systems when text structures are quite complicated and cannot be separated with a single command.

To list usernames on Linux using the awk interpreter, run the following command

$ cat /etc/passwd | awk -F: '{print $1}'

b – List Usernames using awk -list

List Users on Linux using getent

The easiest way to list users on Linux is to use the “getent” command with the “passwd” argument and specify an optional user that you want to list on your system.

getent passwd <optional_user>

As a reminder, the getent command retrieves entries from Name Service Switch databases.

The Name Service Switch is a Unix utility that retrieves entries from a set of different datasources such as files, LDAP, a DNS server or a Network Information Service.

The list of all the datasources available can be read from the nsswitch.conf file located at /etc.

List Users on Linux using getent nsswitch

In our case, it can be used in order to list users and groups easily on our Linux host.

To list users using the getent function, run the following command

$ getent passwd

getent-passwd

a – List Usernames with getent

Similarly to the previous section, it is possible to list only usernames when interacting with the getent command.

To achieve that, you can alternatively execute the cut command or the awk command in the following way.

$ getent passwd | cut -d: -f1

Or with AWK

$ getent passwd | awk -F: '{print $1}'

a – List Usernames with getent-passwd

List Connected Users on your Linux host

As mentionned previously, inspecting the passwd file, either with less or with getent, does not provide you with a list of all the connected users on your host.

To achieve that, you are going to use the who command.

$ who

List Connected Users on your Linux host who

As you can see, you are provided with a list of users currently connected on your host along with the shell they are using and when they connected.

Alternatively, you can use the users command to achieve the same result with less details.

$ users
devconnected john

Pretty handy!

Now that we have seen how we can list users on a Linux host, let’s see how we can apply the same knowledge to list groups on your system.

List Groups on Linux using the /etc/group file

In order to list groups on Linux, you have to execute the “cat” command on the “/etc/group” file. When executing this command, you will be presented with the list of groups available on your system.

Use one of the following commands to list groups on your system.

$ cat /etc/group

$ less /etc/group

$ more /etc/group
List Groups on Linux using the etc group file
But what do the columns of the group file even represent?

Let’s take a complete line on the group file to inspect it.

List Groups on Linux using the etc group file group-users

As you can see, similarly to the passwd file, the entries are separated by colons. They are fairly easy to understand.

List Groups on Linux using the etc group file etc-group-file

Note : the password field is not used most of the time, it is reserved to create privileged groups on your system.

List Groupnames using the /etc/group

As you can see, inspecting the /etc/group gives you a complete and sometimes too detailed listing of all the groups on your system.

However, you sometimes want to isolate the groupnames on your group file.

To achieve that, you can either use the cut command or the AWK command.

$ cat /etc/group | cut -d: -f1

List Groupnames using the etc group cut-etc-group

$ cat /etc/group | awk -F: '{print $1}'

List Groupnames using the etc group cut-etc-group-awk

You can of course choose to isolate one group if you want to see which users belong to the group you are targeting.

$ cat /etc/group | grep <group>

List Groupnames using the etc group isolate-one-group

List Groups using getent

Again, you can choose to list groups on Linux by using the getent command.

$ getent <database> <key>

Here, we are interested in the “group” database.

If you choose not to provide a key, you will be provided with the entire group file.

$ getent group

List Groups using getent getent-group

Similarly to the passwd database, you can choose to “target” one specific group by providing a key to the getent function.

$ getent group sudo

List Groups using getent getent-group-sudo

List Groups for the current user

The groups commands is used to get a list of groups a specific user is in.

$ groups <username>

If provided with no arguments, it will return the groups for the user that launched the command.

List Groups for the current user groups

To prove that it provides the groups for the user that launched the command, try to launch the command with sudo privileges.

$ sudo groups

List Groups for the current user sudo-groups

The result is.. root! Because the command is executed as root and root only belongs to one group which is the root group.

Conclusion

In this tutorial, you learnt how you can list users and groups on any Linux based system.

You learnt more about specific configuration file like passwd and group, as well as the getent command for Name Service Switch facilities.

Again, if you are interested in Linux system administration, we have tons of tutorials on the subject in our Linux System Administration category.

Click the image below to check them.

Bash If Else Syntax With Examples

When working with Bash and shell scripting, you might need to use conditions in your script.

In programming, conditions are crucial : they are used to assert whether some conditions are true or not.

In this tutorial, we are going to focus on one of the conditional statement of the Bash language : the Bash if else statement.

We are going to see how you can use this statement to execute your scripts conditionally.

You will also learnt how you can use nested Bash if else statements to create more complex code.

Bash If Else Statement

In order to execute a Bash “if else” statement, you have to use four different keywords : if, then, else and fi :

  • if : represents the condition that you want to check;
  • then : if the previous condition is true, then execute a specific command;
  • else : if the previous condition is false, then execute another command;
  • fi : closes the “if, then, else” statement.

When using the “if else” statement, you will need to enclose conditions in single or double squared brackets.

if [[ condition ]]
then
  <execute command>
else
  <execute another command>
fi

Note that the “ELSE” statement is optional, if you omit it, nothing will be executed if the condition evaluates to false.

Note : you need to separate the condition from the squared brackets with a space, otherwise you might get a syntax error.

If Else Examples

Now that you know more about the Bash “if else” statement, let’s see how you can use it in real world examples.

In this section, we are going to build a script that prints a message if it is executed by the root user.

If the script is not executed by the root user, it is going to write another custom message.

In order to check whether the script is executed by root, we need to see if the UID of the caller is zero.

#!/bin/bash

# If the user is root, its UID is zero.

if [ $UID  -eq  0 ]
then
  echo "You are root!"
else
  echo "You are not root."
fi

If Else Examples bash-else-if

As stated earlier, the “else” statement is not mandatory.

If we omit in our script created earlier, we would still be able to execute the first “then” statement.

#!/bin/bash

# If the user is root, its UID is zero.

if [ $UID  -eq  0 ]
then
  echo "You are root!"
fi

If Else Examples bash-else-if-2

Now, what if you want to add additional “if” statements to your scripts?

Bash If Elif Statement

The “If Elif” statement is used in Bash in order to add an additional “if” statements to your scripts.

In order to execute a Bash “if elif” statement, you have to use five different keywords : if, then, elif, else and fi :

  • if : represents the condition that you want to check;
  • then : if the previous condition is true, then execute a specific command;
  • elif : used in order to add an additional condition to your statement;
  • else: if the previous conditions are false, execute another command;
  • fi : closes the “if, elif, then” statement.
if [[ condition ]]
then
  <execute command>
elif [[ condition ]]
then
  <execute another command>
else
  <execute default command>
fi

Again, the “ELSE” statement is optional, so you may want to omit it if you do not need a default statement.

if [[ condition ]]
then
  <execute command>
elif [[ condition ]]
then
  <execute another command>
fi

If Elif Examples

In our previous section, we used the “if else” statement to check whether a user is root or not.

In this section, we are going to check if the user is root or if the user has a UID of 1002.

If this is not the case, we are going to exit the script and return the prompt to the user.

if [[ $UID  -eq  0 ]]
then
  echo "You are root!"
elif [[ $UID  -eq 1002 ]]
then
  echo "You are user, welcome!"
else
  echo "You are not welcome here."
  exit 1;
fi

If Elif Examples elif

Congratulations, now you know how to use the “if elif” statement!

Now what if you want to have multiple conditions under the same “if” statement?

Multiple Conditions in If Else

In order to have multiple conditions written in the same “if else” statement, you need to separate your conditions with an “AND” operator or a “OR” operator.

# AND operator used in if else.

if [[ <condition_1> && <condition_2> ]];
then
   <execute command>
fi

# OR operator used in if else.
if [[ <condition_1> || <condition_2> ]];
then
   <execute_command>
else
   <execute_another_command>
fi

For example, if you want to write a script that checks that you are the root user and that you provided the correct parameter, you would write :

#!/bin/bash
 
# If the user is root and the first parameter provided is 0.
if [[ $UID -eq 0 && $1 -eq 0 ]];
then
    echo "You provided the correct parameters"
else
    echo "Wrong parameters, try again"
fi

Multiple Conditions in If Else and-operator-1

Nested If Else Statements

In some cases, you want to implement nested conditions in order to have conditions checked under preliminary conditions.

In order to have nested “if else” statements, you simply have to include the “if” statement in another “if” statement and close your nested statement before the enclosing one.

if [[ condition ]]
then  
  if [[ other condition ]]
  then
    <execute command>
  else
    <execute another command>
  fi
fi
Note : make sure to have a closing “fi” statement for every “if” statement that you open. One single “fi” is simply not enough for multiple “if” statements.

Nested Statements Examples

As an example, let’s say that you want to verify that the user is root before verifying that the first argument provided is zero.

To solve that, you would write a nested “if, then, else” statement in the following way :

#!/bin/bash

if [[ $UID -eq 0 ]]
then  
  if [[ $1 -eq 0 ]]
  then
    echo "You are allowed to execute this script."
  else
    echo "You should have provided 0 as the first argument."
  fi
fi

Nested Statements Examples nested-statements

Bash Tests

As you probably noticed, in the previous sections, we used the “-eq” operator in order to compare a variable value to a number.

We did a simple equality check, but what if you want to have an inequality check?

What if you wanted to check whether a value is greater than a given number for example?

In order to perform this, you will need Bash tests.

Bash tests are a set of operators that you can use in your conditional statements in order to compare values together.

Bash tests can be listed by running the “help test” command.

$ help test

Bash Tests help-test

When writing Bash tests, you essentially have three options :

  • Write conditions on file and directories : if they exist, if they are a character file, a device file and so on;
  • Write conditions on numbers : if they are equal to each other, if one is greater than the other;
  • Write conditions on strings : if a string variable is set or if two strings are equal to each other.

Bash File Conditions

Bash file conditions are used in order to check if a file exists or not, if it can be read, modified or executed.

Bash file tests are described in the table below :

Operator Description
-e Checks if the file exists or not
-d Checks if the file is a directory
-b Checks if the file is a block device
-c Checks if the file is a character device
f1 -nt f2 If file f1 is newer than file f2
f1 -ot f2 If file f1 is older than file f2
-r File can be read (read permission)
-w File can be modified (write permission)
-x File can be executed (execute permission)

For example, to check if a file is a directory, you would write the following script

#!/bin/bash

# Checking the first argument provided
if [[ -d $1 ]]
then  
  echo "This is a directory"
else
  echo "Not a directory"
fi

Bash File Conditions directory

Bash Number Conditions

Bash number conditions are used in order to compare two numbers : if they are equal, if one is greater than another or lower than another.

Here is a table of the most used Bash number conditions :

Operator Description
num1 -eq num2 Check if numbers are equal
num1 -ne num2 Check if numbers are not equal
num1 -lt num2 Checking if num1 is lower than num2
num1 -le num2 Lower or equal than num2
num1 -gt num2 Greater than num2
num1 -ge num2 Greater or equal than num2

For example, to check if a number is not equal to zero, you would write :

#!/bin/bash

# Checking the first argument provided
if [[ $1 -eq 0 ]]
then  
  echo "You provided zero as the first argument."
else
  echo "You should provide zero."
fi

Bash String Conditions

Bash string conditions are used to check if two strings are equal or if a string if empty.

Here is a table of the main Bash string conditions :

Operator Description
str1 = str2 Checks if strings are equal or not
str1 != str2 Checks if strings are different
-z str1 Checks if str1 is empty
-n str1 Checks if str1 is not empty

For example, to check if a user provided a value to your script, you would write :

#!/bin/bash

# Checking the first argument provided
if [[ -n $1 ]]
then  
  echo "You provided a value"
else
  echo "You should provide something"
fi

Conclusion

In today’s tutorial, you learnt about the Bash “If Else” statement.

You saw, with examples, that you can build more complex statements : using elif and nested statements.

Finally, you have discovered about Bash tests, what they are and how they are used in order to check conditions in scripts.

If you are interested in Linux System Administration, we have a complete section dedicated to it on the website, so make sure to check it out!

How To Set Environment Variable in Bash

As a system administrator, you probably know how important environment variables are in Bash.

Environment variables are used to define variables that will have an impact on how programs will run.

In Bash, environment variables define many different things : your default editor, your current username or the current timezone.

Most importantly, environment variables can be used in Bash scripts in order to modify the behaviour of your scripts.

In this tutorial, we are going to see how you can easily set environment variables in Bash.

Set Environment Variables in Bash

The easiest way to set environment variables in Bash is to use the “export” keyword followed by the variable name, an equal sign and the value to be assigned to the environment variable.

For example, to assign the value “abc” to the variable “VAR“, you would write the following command

$ export VAR=abc

If you want to have spaces in your value, such as “my value” or “Linus Torvalds“, you will have to enclose your value in double quotes.

$ export VAR="my value"

$ export VAR="Linus Torvalds"

Set Environment Variables in Bash export

In order to display of your environment variable, you have to precede the variable with a dollar sign.

$ echo $VAR

Linus Torvalds

Similarly, you can use the “printenv” command in order to print the value of your environment variable.

This time, you don’t have to precede it with a dollar sign.

$ printenv VAR

Linus Torvalds

Setting variables using Bash interpolation

In some cases, you may need to set a specific environment variable to the result of a command on your server.

In order to achieve that, you will need Bash interpolation, also called parameter substitution.

Let’s say for example that you want to store the value of your current shell instance in a variable named MYSHELL.

To set an environment variable using parameter substitution, use the “export” keyword and have the command enclosed in closing parenthesis preceded by a dollar sign.

$ export VAR=$(<bash command>)

For example, given our previous example, if you want to have the “SHELL” environment variable in a new variable named “MYSHELL”, you would write

$ export MYSHELL=$(echo $SHELL)

Setting variables using Bash interpolation parameter-substitution

Congratulations, you have successfully created your first environment variable in Bash!

Setting Permanent Environment Variables in Bash

When you assign a value to a variable using “export” in a shell, the changes are not persisted on reboots or to other shells.

In order to set a permanent environment variable in Bash, you have to use the export command and add it either to your “.bashrc” file (if this variable is only for you) or to the /etc/environment file if you want all users to have this environment variable.

$ nano /home/user/.bashrc

# Content of the .bashrc file

export VAR="My permanent variable"

Setting Permanent Environment Variables in Bash

For the changes to be applied to your current session, you will have to source your .bashrc file.

$ source .bashrc

Now, you can check the value of your environment variable in every shell that you want.

$ printenv VAR

Setting Permanent Environment Variables in Bash printenv

This variable will be created on every shell instance for the current user.

However, if you add it to the “/etc/environment” file, the environment variable will be set for all the users on your system.

$ nano /etc/environment

# Content of the environment file

export GLOBAL="This is a global variable"

Setting Permanent Environment Variables in Bash global

After sourcing the file, the environment variables will be set for every user on your host.

$ source /etc/environment

$ echo $GLOBAL

global-2

Awesome, you have successfully set a global environment variable on your server!

Conclusion

In this tutorial, you learnt how you can easily set environment variables in Bash using the export command.

You also learnt that changes are not made permanent until you add them to your :

  • .bashrc : if you want the variable to be only for the current user logged-in;
  • /etc/environment : if you want the variable to be shared by all the users on the system.

If you are interested in Linux System Administration, or in Bash, we have a complete section dedicated to it on the website, so make sure to check it out!

How To Chown Recursively on Linux

Chown is a command on Linux that is used in order to change the owner of a set of files or directories.

Chown comes with multiple options and it is often used to change the group owning the file.

However, in some cases, you may need to change the owner of a directory with all the files in it.

For that, you may need to use one of the options of the chown command : recursive chown.

In this tutorial, you are going to learn how you can recursively use the chown command to change folders and files permissions recursively.

Chown Recursively

The easiest way to use the chown recursive command is to execute “chown” with the “-R” option for recursive and specify the new owner and the folders that you want to change.

$ chown -R <owner> <folder_1> <folder_2> ... <folder_n>

For example, if you want to change the owner of directories and files contained in the home directory of a specific user, you would write

$ chown -R user /home/user

Chown Recursively chown-recursive

Note : if you need a complete guide on the chown command, we wrote an extensive one about file permissions on Linux.

Chown User and Group Recursively

In order to change the user and the group owning the directories and files, you have to execute “chown” with the “-R” option and specify the user and the group separated by colons.

$ chown -R <user>:<group> <folder_1> <folder_2> ... <folder_n>

For example, let’s say that you want to change the user owning the files to “user” and the group owning the files to “root”.

In order to achieve that, you would run the following command

$ chown -R user:root /home/user

Chown User and Group Recursively chown-recursive-group

Congratulations, you successfully use the “chown” command recursively to change owners on your server!

Chown recursively using find

Another way of using the “chown” command recursively is to combine it with the “find” command in find files matching a given pattern and changing their owners and groups.

$ find <path> -name <pattern> -exec chown <user>:<group> {} \;

For example, let’s say that you want to change the owner for all the TXT files that are present inside a given directory on your server.

First of all, it is very recommended to execute the “find” command alone in order to verify that you are matching the correct files.

In this example, we are going to match all the TXT files in the home directory of the current user.

$ find /home/user -name *.txt

Chown recursively using find

Now that you made sure that you are targeting the correct files, you can bind it with the “chown” in order to recursively change permissions.

$ find /home/user -name *.txt -exec chown user {} \;

Chown recursively using find-chown

As you can see, the owner of the TXT files were changed, yet none of the other files and directories were altered.

Being careful with recursive chown

On Linux, executing commands such as chown, chmod or rm is definitive : there is no going back.

As a consequence, you will have to be very careful not to execute any commands that will harm your system.

This point is illustrated in the previous section : we run the find command alone and we made sure it was the correct result.

Then, we executed the chown command in order to recursively change files permissions from the previous command.

As a rule of thumb : if you are not sure of the output of a command, divide it into smaller pieces until you are sure that you won’t execute anything harmful.

Conclusion

In this tutorial, you learnt how you can execute the chown command recursively on your system.

You learnt that you can achieve it using the “-R” option or by combining it with the find command.

Linux Permissions are a wide topic : we really encourage you to have a look at our complete guide on Linux Permissions if you want to learn more.

Also, if you are interested in Linux System Administration, we have a complete section dedicated to it on the website, so make sure to check it out!

How To Ping Specific Port Number

Pinging ports is one of the most effective troubleshooting technique in order to see if a service is alive or not.

Used by system administrators on a daily basis, the ping command, relying on the ICMP protocol, retrieves operational information about remote hosts.

However, pinging hosts is not always sufficient : you may need to ping a specific port on your server.

This specific port might be related to a database, or to an Apache web server or even to a proxy server on your network.

In this tutorial, we are going to see how you can ping a specific port using a variety of different commands.

Ping Specific Port using telnet

The easiest way to ping a specific port is to use the telnet command followed by the IP address and the port that you want to ping.

You can also specify a domain name instead of an IP address followed by the specific port to be pinged.

$ telnet <ip_address> <port_number>

$ telnet <domain_name> <port_number>

The “telnet” command is valid for Windows and Unix operating systems.

If you are facing the “telnet : command not found” error on your system, you will have to install telnet on your system by running the following commands.

$ sudo apt-get install telnet

As an example, let’s say that we have a website running on an Apache Web Server on the 192.168.178.2 IP address on our local network.

By default, websites are running on port 80 : this is the specific port that we are going to ping to see if our website is active.

$ telnet 192.168.178.2 80

Trying 192.168.178.2...
Connected to 192.168.178.2.
Escape character is '^]'.

$ telnet 192.168.178.2 389
Connected to 192.168.178.2.
Escape character is '^]'.

Being able to connect to your remote host simply means that your service is up and running.

In order to quit the Telnet utility, you can use the “Ctrl” + “]” keystrokes to escape and execute the “q” command to quit.

Ping Specific Port using telnet

Ping Specific Port using nc

In order to ping a specific port number, execute the “nc” command with the “v” option for “verbose”, “z” for “scanning” and specify the host as well as the port to be pinged.

You can also specify a domain name instead of an IP address followed by the port that you want to ping.

$ nc -vz <host> <port_number>

$ nc -vz <domain> <port_number>

This command works for Unix systems but you can find netcat alternatives online for Windows.

If the “nc” command is not found on your system, you will need to install by running the “apt-get install” command as a sudo user.

$ sudo apt-get install netcat

As an example, let’s say that you want to ping a remote HTTP website on its port 80, you would run the following command.

$ nc -vz amazon.com 80

amazon.com [<ip_address>] 80 (http) open

Ping Specific Port using nc netcat

As you can see, the connection was successfully opened on port 80.

On the other hand, if you try to ping a specific port that is not open, you will get the following error message.

$ nc -vz amazon.com 389

amazon.com [<ip_address>] 389 (ldap) : Connection refused

Ping Ports using nmap

A very easy way to ping a specific port is to use the nmap command with the “-p” option for port and specify the port number as well as the hostname to be scanned.

$ nmap -p <port_number> <ip_address>

$ nmap -p <port_number> <domain_name>
Note : if you are using nmap, please note that you should be aware of legal issues that may come along with it. For this tutorial, we are assuming that you are scanning local ports for monitoring purposes only.

If the “nmap” command is not available on your host, you will have to install it.

$ sudo apt-get install nmap

As an example, let’s say that you want to ping the “192.168.178.35/24” on your local network on the default LDAP port : 389.

$ nmap -p 389 192.168.178.35/24

Ping Ports using nmap port-up


As you can see, the port 389 is said to be open on this virtual machine stating that an OpenLDAP server is running there.

Scanning port range using nmap

In order to scan a range of ports using nmap, you can execute “nmap” with the “p” option for “ports” and specify the range to be pinged.

$ nmap -p 1-100 <ip_address>

$ nmap -p 1-100 <hostname>

Again, if we try to scan a port range on the “192.168.178.35/24”, we would run the following command

$ nmap -p 1-100 192.168.178.35/24

Scanning port range using nmap closed

Ping Specific Port using Powershell

If you are running a computer in a Windows environment, you can ping specific port numbers using Powershell.

This option can be very useful if you plan on including this functionality in automated scripts.

In order to ping a specific port using Powershell, you have to use the “Test-NetConnection” command followed by the IP address and the port number to be pinged.

$ Test-NetConnection <ip_address> -p <port_number>

As an example, let’s say that we want to ping the “192.168.178.35/24” host on the port 389.

To achieve that, we would run the following command

$ Test-NetConnection 192.168.178.35 -p 389

Ping Specific Port using Powershell

On the last line, you are able to see if the TCP call succeeded or not : in our case, it did reach the port on the 389 port.

Word on Ping Terminology

Technically, there is no such thing as “pinging” a specific port on a host.

Sending a “ping” request to a remote host means that you are using the ICMP protocol in order to check network connectivity.

ICMP is mainly used in order to diagnose network problems that would prevent you from reaching hosts.

When you are “pinging a port“, you are in reality establishing a TCP connection between your computer and a remote host on a specific port.

However, it is extremely common for engineers to state that they are “pinging a port” but in reality they are either scanning or opening TCP connections.

Conclusion

In this tutorial, you learnt all the ways that can be used in order to ping a specific port.

Most of the commands used in this tutorial can be used on WindowsUnix or MacOS operating systems.

They might not be directly available to you, but you will be able to find free and open source alternatives for your operating system.

If you are interested in Linux System Administration, we have a complete section dedicated to it on the website, so make sure to check it out!

LVM Snapshots Backup and Restore on Linux

In our previous tutorials, we have seen that implementing LVM volumes can be very beneficial in order to manage space on your host.

The Logical Volume Management layer exposes an API that can be used in order to add or remove space at will, while your system is running.

However, there is another key feature exposed by LVM that can be very beneficial to system administrators : LVM snapshots.

In computer science, snapshots are used to describe the state of a system at one particular point in time.

In this tutorial, we are going to see how you can implement LVM snapshots easily.

We are also going to see how you can backup an entire filesystem using snapshots and restore it at will.

Prerequisites

In order to create LVM snapshots, you obviously need to have at least a logical volume created on your system.

If you are not sure if this is the case or not, you can run the “lvs” command in order to display existing logical volumes.

$ lvs

LVM Snapshots Backup and Restore on Linux lvs

In this situation, we have a 3 GB logical volume created on our system.

However, having a 3 GB logical volume does not necessarily mean that the entire space is used on our system.

To check the actual size of your logical volume, you can check your used disk space using the “df” command.

$ df -h
Note : your logical volume needs to be mounted in order for you to check the space used..

If you are not sure about mounting logical volumes or partitions, check our tutorial on mounting filesystems.

LVM Snapshots Backup and Restore on Linux df-2

As you can see here, the logical volume has a 3 GB capacity, yet only 3.1 MB are used on the filesystem.

As an example, let’s say that we want to backup the /etc folder of our server.

$ cp -R /etc /mnt/lv_mount

Now that our configuration folder is copied to our logical volume, let’s see how we can creating a LVM snapshot of this filesystem.

Creating LVM Snapshots using lvcreate

In order to create a LVM snapshot of a logical volume, you have to execute the “lvcreate” command with the “-s” option for “snapshot”, the “-L” option with the size and the name of the logical volume.

Optionally, you can specify a name for your snapshot with the “-n” option.

$ lvcreate -s -n <snapshot_name> -L <size> <logical_volume>

Creating LVM Snapshots using lvcreate snapshot

Note : you won’t be able to create snapshot names having “snapshot” in the name as it is a reserved keyword.

You will also have to make sure that you have enough remaining space in the volume group as the snapshot will be created in the same volume group by default.

Now that your snapshot is created, you can inspect it by running the “lvs” command or the “lvdisplay” command directly.

$ lvs

$ lvdisplay <snapshot_name>

Creating LVM Snapshots using lvcreate lvs-2

As you can see, the logical volume has a set of different attributes compared to the original logical volume :

  • s : for snapshot, “o” meaning origin for the original logical volume copied to the snapshot;
  • : for writeable meaning that your snapshot has read and write permissions on it;
  • i : for “inherited”;
  • a : for “allocated”, meaning that actual space is dedicated to this logical volume;
  • o : (in the sixth field) meaning “open” stating that the logical volume is mounted;
  • s : snapshot target type for both logical volumes

Now that your snapshot logical volume is created, you will have to mount it in order to perform a backup of the filesystem.

Mounting LVM snapshot using mount

In order to mount a LVM snapshot, you have to use the “mount” command, specify the full path to the logical volume and specify the mount point to be used.

$ mount <snapshot_path> <mount_point>

As an example, let’s say that we want to mount the “/dev/vg_1/lvol0” to the “/mnt/lv_snapshot” mount point on our system.

To achieve that, we would run the following command :

$ mount /dev/vg_1/lvol0 /mnt/snapshot

You can immediately verify that the mounting operating is effective by running the “lsblk” command again.

$ lsblk

Mounting LVM snapshot using mount lsblk

Backing up LVM Snapshots

Now that your snapshot is mounted, you will be able to perform a backup of it using either the tar or the rsync commands.

When performing backups, you essentially have two options : you can perform a local copy, or you can choose to transfer archives directly to a remote backup server.

Creating a local LVM snapshot backup

The easiest way to backup a LVM snapshot is to use the “tar” command with the “-c” option for “create”, the “z” option in order to create a gzip file and “-f” to specify a destination file.

$ tar -cvzf backup.tar.gz <snapshot_mount>

In our case, as the snapshot is mounted on the “/mnt/lv_snapshot” mountpoint, the backup command would be :

$ tar -cvzf backup.tar.gz /mnt/lv_snapshot

When running this command, a backup will be created in your current working directory.

Creating and transferring a LVM snapshot backup

In some cases, you own a backup server that can be used in order to store LVM backups on a regular basis.

To create such backups, you are going to use the “rsync” command, specify the filesystem to be backed up as well as the destination server to be used.

# If rsync is not installed already, you will have to install using apt
$ sudo apt-get install rsync

$ rsync -aPh <snapshot_mount> <remote_user>@<destination_server>:<remote_destination>
Note : if you are not sure about file transfers on Linux, you should check the tutorial we wrote on the subject.

As an example, let’s say that the snapshot is mounted on the “/mnt/lv_snapshot” and that we want to send the snapshot to the backup server sitting on the “192.168.178.33” IP address.

To connect to the remote backup server, we use the “kubuntu” account and we choose to have files stored in the “/backups” folder.

$ rsync -aPh /mnt/lv_snapshot kubuntu@192.168.178.33:/backups

Now that your logical volume snapshot is backed up, you will be able to restore it easily on demand.

Creating and transferring a LVM snapshot backup

Restoring LVM Snapshots

Now that your LVM is backed up, you will be able to restore it on your local system.

In order to restore a LVM logical volume, you have to use the “lvconvert” command with the “–mergesnapshot” option and specify the name of the logical volume snapshot.

When using the “–mergesnapshot”, the snapshot is merged into the original logical volume and is deleted right after it.

$ lvconvert --mergesnapshot <snapshot_logical_volume>

In our case, the logical volume snapshot was named lvol0, so we would run the following command

$ lvconvert --mergesnapshot vg_1/lvol0

Restoring LVM Snapshots lvconvert

As you probably noticed, both devices (the original and the snapshot can’t be open for the merge operation to succeed.

Alternatively, you can refresh the logical volume for it to reactivate using the latest metadata using “lvchange”

$ lvchange --refresh vg_1/lv_1

After the merging operation has succeeded, you can verify that your logical volume was successfully removed from the list of logical volumes available.

$ lvs

Restoring LVM Snapshots lvs-3

Done!

The logical volume snapshot is now removed and the changes were merged back to the original logical volume.

Conclusion

In this tutorial, you learnt about LVM snapshots, what they are and how they can be used in order to backup and restore filesystems.

Creating backups on a regular basis is essential, especially when you are working in a medium to large company.

Having backups and being able to restore them easily is the best way to make sure that you will be able to prevent major data loss on your systems.

If you are interested in Linux System Administration, we have a complete section dedicated to it on the website, so make sure to check it out!

How To Search LDAP using ldapsearch (With Examples)

If you are working in a medium to large company, you are probably interacting on a daily basis with LDAP.

Whether this is on a Windows domain controller, or on a Linux OpenLDAP server, the LDAP protocol is very useful to centralize authentication.

However, as your LDAP directory grows, you might get lost in all the entries that you may have to manage.

Luckily, there is a command that will help you search for entries in a LDAP directory tree : ldapsearch.

In this tutorial, we are going to see how you can easily search LDAP using ldapsearch.

We are also going to review the options provided by the command in order to perform advanced LDAP searches.

Search LDAP using ldapsearch

The easiest way to search LDAP is to use ldapsearch with the “-x” option for simple authentication and specify the search base with “-b”.

If you are not running the search directly on the LDAP server, you will have to specify the host with the “-H” option.

$ ldapsearch -x -b <search_base> -H <ldap_host>

As an example, let’s say that you have an OpenLDAP server installed and running on the 192.168.178.29 host of your network.

If your server is accepting anonymous authentication, you will be able to perform a LDAP search query without binding to the admin account.

$ ldapsearch -x -b "dc=devconnected,dc=com" -H ldap://192.168.178.29

Search LDAP using ldapsearch ldapsearch

As you can see, if you don’t specify any filters, the LDAP client will assume that you want to run a search on all object classes of your directory tree.

As a consequence, you will be presented with a lot of information. If you want to restrict the information presented, we are going to explain LDAP filters in the next chapter.

Search LDAP with admin account

In some cases, you may want to run LDAP queries as the admin account in order to have additionnal information presented to you.

To achieve that, you will need to make a bind request using the administrator account of the LDAP tree.

To search LDAP using the admin account, you have to execute the “ldapsearch” query with the “-D” option for the bind DN and the “-W” in order to be prompted for the password.

$ ldapsearch -x -b <search_base> -H <ldap_host> -D <bind_dn> -W

As an example, let’s say that your administrator account has the following distinguished name : “cn=admin,dc=devconnected,dc=com“.

In order to perform a LDAP search as this account, you would have to run the following query

$ ldapsearch -x -b "dc=devconnected,dc=com" -H ldap://192.168.178.29 -D "cn=admin,dc=devconnected,dc=com" -W

Search LDAP with search-admin-account

When running a LDAP search as the administrator account, you may be exposed to user encrypted passwords, so make sure that you run your query privately.

Running LDAP Searches with Filters

Running a plain LDAP search query without any filters is likely to be a waste of time and resource.

Most of the time, you want to run a LDAP search query in order to find specific objects in your LDAP directory tree.

In order to search for a LDAP entry with filters, you can append your filter at the end of the ldapsearch command : on the left you specify the object type and on the right the object value.

Optionally, you can specify the attributes to be returned from the object (the username, the user password etc.)

$ ldapsearch <previous_options> "(object_type)=(object_value)" <optional_attributes>

Finding all objects in the directory tree

In order to return all objects available in your LDAP tree, you can append the “objectclass” filter and a wildcard character “*” to specify that you want to return all objects.

$ ldapsearch -x -b <search_base> -H <ldap_host> -D <bind_dn> -W "objectclass=*"

When executing this query, you will be presented with all objects and all attributes available in the tree.

Finding user accounts using ldapsearch

For example, let’s say that you want to find all user accounts on the LDAP directory tree.

By default, user accounts will most likely have the “account” structural object class, which can be used to narrow down all user accounts.

$ ldapsearch -x -b <search_base> -H <ldap_host> -D <bind_dn> -W "objectclass=account"

By default, the query will return all attributes available for the given object class.

Finding user accounts using ldapsearch search-user

As specified in the previous section, you can append optional attributes to your query if you want to narrow down your search.

For example, if you are interested only in the user CN, UID, and home directory, you would run the following LDAP search

$ ldapsearch -x -b <search_base> -H <ldap_host> -D <bind_dn> -W "objectclass=account" cn uid homeDirectory

Finding user accounts using ldapsearch attributes

Awesome, you have successfully performed a LDAP search using filters and attribute selectors!

AND Operator using ldapsearch

In order to have multiple filters separated by “AND” operators, you have to enclose all the conditions between brackets and have a “&” character written at the beginning of the query.

$ ldapsearch <previous_options> "(&(<condition_1>)(<condition_2>)...)"

For example, let’s say that you want to find all entries have a “objectclass” that is equal to “account” and a “uid” that is equal to “john”, you would run the following query

$ ldapsearch <previous_options> "(&(objectclass=account)(uid=john))"

AND Operator using ldapsearch and-operator

OR Operator using ldapsearch

In order to have multiple filters separated by “OR” operators, you have to enclose all the conditions between brackets and have a “|” character written at the beginning of the query.

$ ldapsearch <previous_options> "(|(<condition_1>)(<condition_2>)...)"

For example, if you want to find all entries having a object class of type “account” or or type “organizationalRole”, you would run the following query

$ ldapsearch <previous_options> "(|(objectclass=account)(objectclass=organizationalRole))"

Negation Filters using ldapsearch

In some cases, you want to negatively match some of the entries in your LDAP directory tree.

In order to have a negative match filter, you have to enclose your condition(s) with a “!” character and have conditions separated by enclosing parenthesis.

$ ldapsearch <previous_options> "(!(<condition_1>)(<condition_2>)...)"

For example, if you want to match all entries NOT having a “cn” attribute of value “john”, you would write the following query

$ ldapsearch <previous_options> "(!(cn=john))"

Finding LDAP server configuration using ldapsearch

One advanced usage of the ldapsearch command is to retrieve the configuration of your LDAP tree.

If you are familiar with OpenLDAP, you know that there is a global configuration object sitting at the top of your LDAP hierarchy.

In some cases, you may want to see attributes of your LDAP configuration, in order to modify access control or to modify the root admin password for example.

To search for the LDAP configuration, use the “ldapsearch” command and specify “cn=config” as the search base for your LDAP tree.

To run this search, you have to use the “-Y” option and specify “EXTERNAL” as the authentication mechanism.

$ ldapsearch -Y EXTERNAL -H ldapi:/// -b cn=config
Note : this command has to be run on the server directly, not from one of your LDAP clients.

Finding LDAP server configuration using ldapsearch config

By default, this command will return a lot of results as it returns backends, schemas and modules.

If you want to restrict your search to database configurations, you can specify the “olcDatabaseConfig” object class with ldapsearch.

$ ldapsearch -Y EXTERNAL -H ldapi:/// -b cn=config "(objectclass=olcDatabaseConfig)"

Using Wildcards in LDAP searches

Another powerful way of searching through a list of LDAP entries is to use wildcards characters such as the asterisk (“*”).

The wildcard character has the same function as the asterisk you use in regex : it will be used to match any attribute starting or ending with a given substring.

$ ldapsearch <previous_options> "(object_type)=*(object_value)"

$ ldapsearch <previous_options> "(object_type)=(object_value)*"

As an example, let’s say that you want to find all entries having an attribute “uid” starting with the letter “j”.

$ ldapsearch <previous_options> "uid=jo*"

Using Wildcards in LDAP searches wildcards

Ldapsearch Advanced Options

In this tutorial, you learnt about basic ldapsearch options but there are many others that may be interested to you.

LDAP Extensible Match Filters

Extensible LDAP match filters are used to supercharge existing operators (for example the equality operator) by specifying the type of comparison that you want to perform.

Supercharging default operators

To supercharge a LDAP operator, you have to use the “:=” syntax.

$ ldapsearch <previous_options> "<object_type>:=<object_value>"

For example, if you want to search for all entries have a “cn” that is equal to “john,” you would run the following command

$ ldapsearch <previous_options> "cn:=john"

# Which is equivalent to

$ ldapsearch <previous_options> "cn=john"

As you probably noticed, running the search on “john” or on “JOHN” returns the same exact result.

As a consequence, you may want to constraint the results to the “john” exact match, making the search case sensitive.

Using ldapsearch, you can add additional filters separated by “:” characters.

$ ldapsearch <previous_options> "<object_type>:<op1>:<op2>:=<object_value>"

For example, in order to have a search which is case sensitive, you would run the following command

$ ldapsearch <previous_options> "cn:caseExactMatch:=john"

If you are not familiar with LDAP match filters, here is a list of all the operators available to you.

Conclusion

In this tutorial, you learnt how you can search a LDAP directory tree using the ldapsearch command.

You have seen the basics of searching basic entries and attributes as well as building complex matching filters with operators (and, or and negative operators).

You also learnt that it is possible to supercharge existing operators by using extensible match options and specifying the custom operator to be used.

If you are interested in Advanced Linux System Administration, we have a complete section dedicated to it on the website, so make sure to check it out!