Docker Exec Command With Examples

Docker Exec Command With Examples | How to Run a Docker Exec Command inside a Docker Container?

Developers who need full-fledged information about Docker and their commands with examples can stick to Junosnotes.com especially this tutorial. As it was completely explained regarding the Docker Exec Command with Examples. 

Before going to the main topic of today’s, let’s have a look at Docker. It is a containerization platform founded in 2010 by Solomon Hykes that offers features to install, deploy, start and stop containers.

The command that helps to execute commands on running containers is known as the Docker exec command and makes it possible to access a shell example or start a CLI to manage your servers.

Get the main part of data about it by going through this tutorial and keep focusing on learning the docker exec command efficiently & effortlessly.

What is Docker Exec Command?

One of the useful and best commands to interact with your running docker containers is the Docker exec command. By using the docker exec, you will likely have the need to access the shell or CLI of the docker containers you have deployed when working with Docker.

Docker Exec Syntax

In order to execute commands on running containers, you have to execute “docker exec” and specify the container name (or ID) as well as the command to be executed on this container.

$ docker exec <options> <container> <command>

As an example, let’s say that you want to execute the “ls” command on one of your containers.

The first thing that you need to do is to identify the container name (if you gave your container one) or the container ID.

In order to determine the container name or ID, you can simply execute the “docker ps” command.

$ docker ps

CONTAINER ID        IMAGE               COMMAND             CREATED             STATUS              
74f86665f0fd        ubuntu:18.04        "/bin/bash"         49 seconds ago      Up 48 seconds

Note: The “docker ps” is also used in order to determine whether a container is running or not.

As you can see, the container ID is the first column of the ‘docker ps’ output.

Now, to execute the “ls” command on this container, simply append the ‘ls’ command to the ID of your container.

$ docker exec 74f86665f0fd ls

bin
boot
dev
etc
home

Awesome, now that you know how you can use the “docker exec” command, let’s see some custom examples on the usage of this command.

Prerequisites

If you want to go with the examples provided on this page then you should have to adhere to the following requirements:

Docker Exec Bash / Docker Exec -it

The most popular usage of the “docker exec” command is to launch a Bash terminal within a container.

To start a Bash shell in a Docker container, execute the “docker exec” command with the “-it” option and specify the container ID as well as the path to the bash shell.

If the Bash is part of your PATH, you can simply type “bash” and have a Bash terminal in your container.

$ docker exec -it <container> /bin/bash

# Use this if bash is part of your PATH

$ docker exec -it <container> bash

When executing this command, you will have an interactive Bash terminal where you can execute all the commands that you want.

Docker Exec Bash Cmder

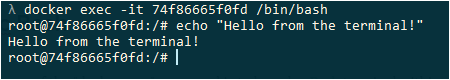
Awesome, you are now running an interactive Bash terminal within your container.

As you can see, we used an option that we did not use before to execute our command: the I and T options.

What is the purpose of those options?

Docker Exec Interactive Option (IT)

If you are familiar with Linux operating systems, you have probably already heard about the concept of file descriptors.

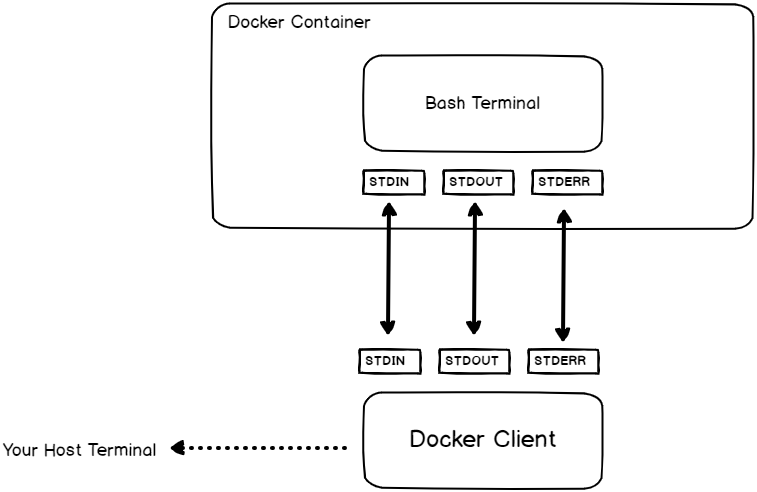
Whenever you are executing a command, you are creating three file descriptors:

  • STDIN: also called the standard input that will be used in order to type and submit your commands (for example a keyboard, a terminal, etc..);
  • STDOUT: called the standard output, this is where the process outputs will be written (the terminal itself, a file, a database, etc..);
  • STDERR: called the standard error, it is very related to the standard output and is used in order to display errors.

So how are file descriptors related to the “docker exec“?

When running “docker exec” with the “-i” option, you are binding the standard input of your host to the standard input of the process you are running in the container.

In order to get the results from your command, you are also binding the standard output and the standard error to the ones from your host machine.

Docker Exec Interactive Option (IT) it-option

As you are binding the standard input from your host to the standard input of your container, you are running the command “interactively”.

If you don’t specify the “IT” option, Bash will still get executed in the container but you won’t be able to submit commands to it.

Docker Exec as Root

In some cases, you are interested in running commands in your container as the root user.

In order to execute a command as root on a container, use the “docker exec” command and specify the “-u” with a value of 0 for the root user.

$ docker exec -u 0 <container> <command>

For example, in order to make sure that we execute the command as root, let’s have a command that prints the user currently logged in the container.

$ docker exec -u 0 74f86665f0fd whoami

root

Great, you are now able to run commands as the root user within a container with docker exec.

Docker Exec Multiple Commands

In order to execute multiple commands using the “docker exec” command, execute “docker exec” with the “bash” process and use the “-c” option to read the command as a string.

$ docker exec <container> bash -c "command1 ; command2 ; command3"

Note: Simple quotes may not work in your host terminal, you will have to use double quotes to execute multiple commands.

For example, let’s say that you want to change the current directory within the container and read a specific log file in your container.

To achieve that, you are going to execute two commands: “cd” to change directory and “cat” to read the file content.

$ docker exec 74f86665f0fd bash -c "cd /var/log ; cat dmesg "

(Nothing has been logged yet.)

Executing a command in a specific directory

In some cases, the purpose of executing multiple commands is to navigate to a directory in order to execute a specific command in this directory.

You can use the method we have seen before, but Docker provides a special option for this.

In order to execute a command within a specific directory in your container, use “docker exec” with the “-w” and specify the working directory to execute the command.

$ docker exec -w /path/to/directory <container> <command>

Given the example we have seen before, where we inspected the content of a specific log file, it could be shortened to

$ docker exec -w /var/log 74f86665f0fd cat dmesg

(Nothing has been logged yet.)

Docker Run vs Exec

Now that we have seen multiple ways of using the “docker exec” command, you may wonder what is the difference with the “docker run” command.

The difference between “docker run” and “docker exec” is that “docker exec” executes a command on a running container. On the other hand, “docker run” creates a temporary container, executes the command in it, and stops the container when it is done.

For example, you can execute a Bash shell using the “docker run” command but your container will be stopped when exiting the Bash shell.

$ docker run -it ubuntu:18.04 bash

root@b8d2670657e3:/# exit

$ docker ps

(No containers.)

On the other hand, if a container is started, you can start a Bash shell in it and exit it without the container stopping at the same time.

$ docker ps

CONTAINER ID        IMAGE               COMMAND             CREATED             STATUS              
74f86665f0fd        ubuntu:18.04        "/bin/bash"         49 seconds ago      Up 48 seconds  

$ docker exec -it 74f86665f0fd bash
root@74f86665f0fd:/# exit


$ docker ps

CONTAINER ID        IMAGE               COMMAND             CREATED             STATUS              
74f86665f0fd        ubuntu:18.04        "/bin/bash"         58 seconds ago      Up 58 seconds

Awesome, you know the difference between “docker run” and “docker exec” now.

Set Environment Variables

Setting environment variables is crucial for Docker: you may run databases that need specific environment variables to work properly.

Famous examples are Redis, MongoDB, or MySQL databases.

In order to set environment variables, execute “docker exec” with the “-e” option and specify the environment variable name and value next to it.

$ docker exec -e var='value' <container> <command>

For example, let’s have a command that sets the “UID” environment variable to print it out within the container.

To achieve that, we would use the “-e” option in order to set the environment variable.

$ docker exec -e UID='myuser' 74f86665f0fd printenv UID

'myuser'

How to Run a Docker Exec Command inside a Docker Container?

  • Make use of docker ps to get the name of the existing container.
  • Later, use the command docker exec -it <container name> /bin/bash to get a bash shell in the container.
  • Or straight away use docker exec -it <container name> <command> to execute whatever command you specify in the container.

Conclusion

In this tutorial, you learned about the “docker exec” command: command used to execute commands on your existing running containers.

If you are interested in DevOps or Docker, we have a complete section dedicated to it on the website, so make sure to check it out!

Monitoring Linux Processes using Prometheus and Grafana

Monitoring Linux Processes using Prometheus and Grafana | Prometheus & Grafana Linux Monitoring

By referring to this tutorial, all Linux OS developers, system administrators, DevOps engineers, and many other technical developers can easily learn and perform Monitoring Linux Processes using Prometheus and Grafana. Follow this guide until you get familiar with the process.

Monitoring Linux Processes using Prometheus and Grafana Final-dashboard

One of the most difficult tasks for a Linux system administrator or a DevOps engineer would be tracking performance metrics on the servers. Sometimes, you may also get real issues like running very slow, unresponsive examples may be blocking you from running remote commands like top or htop on them. Moreover, you can also get a bottleneck on your server, but you cannot recognize it easily and fastly.

Do you need the entire monitoring technique to track all these general performance issues and resolve them from time to time by using various individual processes? Then this can be possible by following the tutorial carefully. Let’s see it live here for now:

Monitoring Linux Processes using Prometheus and Grafana featured-2

The main objective of this tutorial is to design a complete monitoring dashboard for Linux sysadmins.

Do Check Other Monitoring Guides: 

As a result, it will showcase several panels that are entirely customizable and scalable to multiple instances for distributed architectures.

What You Will Learn

Before jumping right into this technical journey, let’s have a quick look at everything that you are going to learn by reading this article:

  • Understanding current state-of-the-art ways to monitor process performance on Unix systems;
  • Learn how to install the latest versions of Prometheus v2.9.2Pushgateway v0.8.0, and Grafana v6.2;
  • Build a simple bash script that exports metrics to Pushgateway;
  • Build a complete Grafana dashboard including the latest panels available such as the ‘Gauge’ and the ‘Bar Gauge’;
  • Bonus: implementing ad-hoc filters to track individual processes or instances.

Now that we have an overview of everything that we are going to learn, and without further due, let’s have an introduction to what’s currently existing for Unix systems.

Unix Process Monitoring Basics

When it comes to process monitoring for Unix systems, you have multiple options.

The most popular one is probably ‘top’.

Top provides a full overview of performance metrics on your system such as the current CPU usage, the current memory usage as well as metrics for individual processes.

This command is widely used among sysadmins and is probably the first command run when a performance bottleneck is detected on a system (if you can access it of course!)

Unix Process Monitoring Basics final-top-command

The top command is already pretty readable, but there is a command that makes everything even more readable than that: htop.

Htop provides the same set of functionalities (CPU, memory, uptime..) as a top but in a colorful and pleasant way.

Htop also provides gauges that reflect current system usage.

Unix Process Monitoring Basics final-htop-command

Knowing that those two commands exist, why would we want to build yet another way to monitor processes?

The main reason would be system availability: in case of a system overload, you may have no physical or remote access to your instance.

By externalizing process monitoring, you can analyze what’s causing the outage without accessing the machine.

Another reason is that processes get created and killed all the time, often by the kernel itself.

In this case, running the top command would give you zero information as it would be too late for you to catch who’s causing performance issues on your system.

You would have to dig into kernel logs to see what has been killed.

With a monitoring dashboard, you can simply go back in time and see which process was causing the issue.

Now that you know why we want to build this dashboard, let’s have a look at the architecture put in place in order to build it.

Detailing Our Monitoring Architecture

Before having a look at the architecture that we are going to use, we want to use a solution that is:

  • Resource cheap: i.e not consuming many resources on our host;
  • Simple to put in place: a solution that doesn’t require a lot of time to instantiate;
  • Scalable: if we were to monitor another host, we can do it quickly and efficiently.

Those are the points we will keep in mind throughout this tutorial.

The detailed architecture we are going to use today is this one:

Detailing Our Monitoring Architecture process monitoring architecture

Our architecture makes use of four different components:

  • A bash script used to send periodically metrics to the Pushgateway;
  • Pushgateway: a metrics cache used by individual scripts as a target;
  • Prometheus: that instantiates a time series database used to store metrics. Prometheus will scrape Pushgateway as a target in order to retrieve and store metrics;
  • Grafana: a dashboard monitoring tool that retrieves data from Prometheus via PromQL queries and plots them.

For those who are quite familiar with Prometheus, you already know that Prometheus scraps metrics exposed by HTTP instances and stores them.

In our case, the bash script has a very tiny lifespan and it doesn’t expose any HTTP instance for Prometheus.

This is why we have to use the Pushgateway; designed for short-lived jobs, Pushgateway will cache metrics received from the script and expose them to Prometheus.

Detailing Our Monitoring Architecture pull vs push

Installing The Different Tools

Now that you have a better idea of what’s going on in our application, let’s install the different tools needed.

a – Installing Pushgateway

In order to install Pushgateway, run a simple wget command to get the latest binaries available.

wget https://github.com/prometheus/pushgateway/releases/download/v0.8.0/pushgateway-0.8.0.linux-amd64.tar.gz

Now that you have the archive, extract it, and run the executable available in the pushgateway folder.

> tar xvzf pushgateway-0.8.0.linux-amd64.tar.gz
> cd pushgateway-0.8.0.linux-amd64/   
> ./pushgateway &

As a result, your Pushgateway should start as a background process.

me@schkn-ubuntu:~/softs/pushgateway/pushgateway-0.8.0.linux-amd64$ ./pushgateway &

[1] 22806
me@schkn-ubuntu:~/softs/pushgateway/pushgateway-0.8.0.linux-amd64$ 
INFO[0000] Starting pushgateway (version=0.8.0, branch=HEAD, revision=d90bf3239c5ca08d72ccc9e2e2ff3a62b99a122e)  source="main.go:65"INFO[0000] Build context (go=go1.11.8, user=root@00855c3ed64f, date=20190413-11:29:19)  source="main.go:66"INFO[0000] Listening on :9091.                           source="main.go:108"

Nice!

From there, Pushgateway is listening to incoming metrics on port 9091.

b – Installing Prometheus

As described in the ‘Getting Started’ section of Prometheus’s website, head over to https://prometheus.io/download/ and run a simple wget command in order to get the Prometheus archive for your OS.

wget https://github.com/prometheus/prometheus/releases/download/v2.9.2/prometheus-2.9.2.linux -amd64.tar.gz

Now that you have the archive, extract it, and navigate into the main folder:

> tar xvzf prometheus-2.9.2.linux-amd64.tar.gz
> cd prometheus-2.9.2.linux-amd64/

As stated before, Prometheus scraps ‘targets’ periodically to gather metrics from them. Targets (Pushgateway in our case) need to be configured via Prometheus’s configuration file.

> vi prometheus.yml

In the ‘global’ section, modify the ‘scrape_interval’ property down to one second.

global:
  scrape_interval:     1s # Set the scrape interval to every 1 second.

In the ‘scrape_configs’ section, add an entry to the targets property under the static_configs section.

static_configs:
            - targets: ['localhost:9090', 'localhost:9091']

Exit vi, and finally run the Prometheus executable in the folder.

Prometheus should start when launching the final Prometheus command. To assure that everything went correctly, you can head over to http://localhost:9090/graph.

If you have access to Prometheus’s web console, it means that everything went just fine.

You can also verify that Pushgateway is correctly configured as a target in ‘Status’ > ‘Targets’ in the Web UI.

prometheus-web-console-final (1)

c – Installing Grafana

If you are looking for a tutorial to install Grafana on Linux, just follow the link!

Also Check: How To Create a Grafana Dashboard? (UI + API methods)

Last not but least, we are going to install Grafana v6.2. Head over to https://grafana.com/grafana/download/beta.

As done before, run a simple wget command to get it.

> wget https://dl.grafana.com/oss/release/grafana_6.2.0-beta1_amd64.deb> sudo dpkg -i grafana_6.2.0-beta1_amd64.deb

Now that you have extracted the deb file, grafana should run as a service on your instance.

You can verify it by running the following command:

> sudo systemctl status grafana-server
● grafana-server.service - Grafana instance
   Loaded: loaded (/usr/lib/systemd/system/grafana-server.service; disabled; vendor preset: enabled)
   Active: active (running) since Thu 2019-05-09 10:44:49 UTC; 5 days ago
     Docs: http://docs.grafana.org

You can also check http://localhost:3000 which is the default address for Grafana Web UI.

Now that you have Grafana on your instance, we have to configure Prometheus as a datasource.

You can configure your datasource this way :

prometheus-data-source (1)

That’s it!

Click on ‘Save and Test’ and make sure that your datasource is working properly.

Building a bash script to retrieve metrics

Your next task is to build a simple bash script that retrieves metrics such as the CPU usage and the memory usage for individual processes.

Your script can be defined as a cron task that will run every second later on.

To perform this task, you have multiple candidates.

You could run top commands every second, parse it using sed and send the metrics to Pushgateway.

The hard part with top is that it runs on multiple iterations, providing a metrics average over time. This is not really what we are looking for.

Instead, we are going to use the ps command and more precisely the ps aux command.

ps-aux-final

This command exposes individual CPU and memory usages as well as the exact command behind it.

This is exactly what we are looking for.

But before going any further, let’s have a look at what Pushgateway is expecting as input.

Pushgateway, pretty much like Prometheus, works with key-value pairs: the key describes the metric monitored and the value is self-explanatory.

Here are some examples:

pushgateway format

As you can tell, the first form simply describes the CPU usage, but the second one describes the CPU usage for the java process.

Adding labels is a way of specifying what your metric describes more precisely.

Now that we have this information, we can build our final script.

As a reminder, our script will perform a ps aux command, parse the result, transform it and send it to the Pushgateway via the syntax we described before.

Create a script file, give it some rights and navigate to it.

> touch better-top
> chmod u+x better-top
> vi better-top

Here’s the script:

#!/bin/bash
z=$(ps aux)
while read -r z
do
   var=$var$(awk '{print "cpu_usage{process=\""$11"\", pid=\""$2"\"}", $3z}');
done <<< "$z"
curl -X POST -H  "Content-Type: text/plain" --data "$var
" http://localhost:9091/metrics/job/top/instance/machine

If you want the same script for memory usage, simply change the ‘cpu_usage’ label to ‘memory_usage’ and the $3z to $4z

So what does this script do?

First, it performs the ps aux command we described before.

Then, it iterates on the different lines and formats it accordingly to the key-labeled value pair format we described before.

Finally, everything is concatenated and sent to the Pushgateway via a simple curl command.

Simple, isn’t it?

As you can tell, this script gathers all metrics for our processes but it only runs one iteration.

For now, we are simply going to execute it every one second using a sleep command.

Later on, you are free to create a service to execute it every second with a timer (at least with systemd).

Interested in systemd? I made a complete tutorial about monitoring them with Chronograf

> while sleep 1; do ./better-top; done;

Now that our metrics are sent to the Pushgateway, let’s see if we can explore them in Prometheus Web Console.

Head over to http://localhost:9090. In the ‘Expression’ field, simply type ‘cpu_usage’. You should now see all metrics in your browser.

Congratulations! Your CPU metrics are now stored in Prometheus TSDB.

processes web console

Building An Awesome Dashboard With Grafana

Now that our metrics are stored in Prometheus, we simply have to build a Grafana dashboard in order to visualize them.

We will use the latest panels available in Grafana v6.2: the vertical and horizontal bar gaugesthe rounded gauges, and the classic line charts.

For your comfort, I have annotated the final dashboard with numbers from 1 to 4.

They will match the different subsections of this chapter. If you’re only interested in a certain panel, head over directly to the corresponding subsection.

grafana with numeros

1. Building Rounded Gauges

Here’s a closer view of what rounded gauges in our panel.

For now, we are going to focus on the CPU usage of our processes as it can be easily mirrored for memory usage.

With those panels, we are going to track two metrics: the current CPU usage of all our processes and the average CPU usage.

In order to retrieve those metrics, we are going to perform PromQL queries on our Prometheus instance?

So.. what’s PromQL?

PromQL is the query language designed for Prometheus.

Similarly, what you found to find on InfluxDB instances with InfluxQL (or IFQL), PromQL queries can aggregate data using functions such as the sum, the average, and the standard deviation.

The syntax is very easy to use as we are going to demonstrate it with our panels.

a – Retrieving the current overall CPU usage

In order to retrieve the current overall CPU usage, we are going to use the PromQL sum function.

At a given moment in time, our overall CPU usage is simply the sum of individual usages.

Here’s the cheat sheet:

a – Retrieving the current overall CPU usage - total

b – Retrieving the average CPU usage

Not much work to do for average CPU usage, you are simply going to use the  avg function of PromQL. You can find the cheat sheet below.

b – Retrieving the average CPU usage 1b-total

2. Building Horizontal Gauges

Horizontal gauges are one of the latest additions of Grafana v6.2.

Our goal with this panel is to expose the top 10 most consuming processes of our system.

To do so, we are going to use the topk function that retrieves the top k elements for a metric.

Similar to what we did before, we are going to define thresholds in order to be informed when a process is consuming too many resources.

2 – Building Horizontal Gauges 2-total

3. Building Vertical Gauges

Vertical gauges are very similar to horizontal gauges, we only need to tweak the orientation parameter in the visualization panel of Grafana.

Also, we are going to monitor our memory usage with this panel so the query is slightly different.

Here’s the cheat sheet:

3 – Building Vertical Gauges 3-final

Awesome! We have made great progress so far, with one panel to go.

4. Building Line Graphs

Line graphs have been in Grafana for a long time and this is the panel that we are going to use to have a historical view of how our processes have evolved over time.

This graph can be particularly handy when:

  • You had some outages in the past and would like to investigate which processes were active at the time.
  • A certain process died but you want to have a view of its behavior right before it happened

When it comes to troubleshooting exploration, it would honestly need a whole article (especially with the recent Grafana Loki addition).

Okay, here’s the final cheat sheet!

4 – Building Line Graphs 4-final

From there, we have all the panels that we need for our final dashboard.

You can arrange them the way you want or simply take some inspiration from the one we built.

Bonus: explore data using ad hoc filters

Real-time data is interesting to see – but the real value comes when you are able to explore your data.

In this bonus section, we are not going to use the ‘Explore’ function (maybe in another article?), we are going to use ad hoc filters.

With Grafana, you can define variables associated with a graph. You have many different options for variables: you can for example define a variable for your data source that would allow you to dynamically switch the datasource in a query.

In our case, we are going to use simple ad hoc filters to explore our data.

top-panel-2

From there, simply click on ‘Variables’ in the left menu, then click on ‘New’.

variable-configuration-final

As stated, ad hoc filters are automatically applied to dashboards that target the Prometheus datasource. Back to our dashboard.

Take a look at the top left corner of the dashboard.

filters-final

Filters!

Now let’s say that you want the performance of a certain process in your system: let’s take Prometheus itself for example.

Simply navigate into the filters and see the dashboard updating accordingly.

prometheus-filters

Now you have a direct look at how Prometheus is behaving on your instance.

You could even go back in time and see how the process behaved, independently from its pid!

A quick word to conclude

From this tutorial, you now have a better understanding of what Prometheus and Grafana have to offer.

You know have a complete monitoring dashboard for one instance, but there is really a small step to make it scale and monitor an entire cluster of Unix instances.

DevOps monitoring is definitely an interesting subject – but it can turn into a nightmare if you do it wrong.

This is exactly why we write those articles and build those dashboards: to help you reach the maximum efficiency of what those tools have to offer.

We believe that great tech can be enhanced with useful showcases.

Do you?

If you agree, join the growing list of DevOps who chose this path.

It is as simple as subscribing to our newsletter: get those tutorials right into your mailbox!

I made similar articles, so if you enjoyed this one, make sure to read the others :

Until then, have fun, as always.